
API Traffic Analytics (GQL)
Obtain single API and aggregate API request analytics from API consumer, API provider, and/or admin perspectives.
API traffic analytics queries in the GraphQL Platform API are used to obtain request/response metrics from a number of perspectives in the Enterprise Hub. These queries are used behind the scenes to display API usage analytics in the Rapid user interfaces, but you can use these queries directly to populate the data in your own tools, create custom alerts, create custom reports, etc.
From the environment admin perspective, these queries are used to populate information in the Admin Panel's Dashboard and APIs tabs. These queries can provide aggregate usage information for any or all APIs in the Hub.
From an API provider or org admin perspective, these queries are used to populate the Analytics tab in Studio. This provides the API provider with a view of usage of the API across any or all of their API consumers.
From an API consumer or org admin perspective, these queries are used to populate analytics in the Developer Dashboard (Apps). This provides API consumers a view of their usage for each API that the user or team subscribes to.
Obtain aggregate call volume, errors, and latency (apiTrafficAnalyticsSummary)
The apiTrafficAnalyticsSummary query is useful for returning aggregate requests, errors, and latency information for a given time period. This can be useful to report on Enterprise Hub usage and to help identify areas of improvement.
Depending on the metric, the returned information can include total (for example, total errors), min, max, avg, median, and rps (requests per second). The GraphQL query below identifies which returned value applies to each metric type (for example, total latency does not make sense, so it is not returned).
The query is very flexible because it can return data for the entire Enterprise Hub, or can be filtered by API, app, API consumer, endpoint, version, HTTP method, HTTP response, and country of request origin (see the table of where values below).
This query is used behind the scened when displaying aggregate request data in the Analytics tab in Studio and in the APIs Admin Panel. Notice that the user interface below includes the ability to filter the returned data by the API consumer, version, HTTP method, etc.
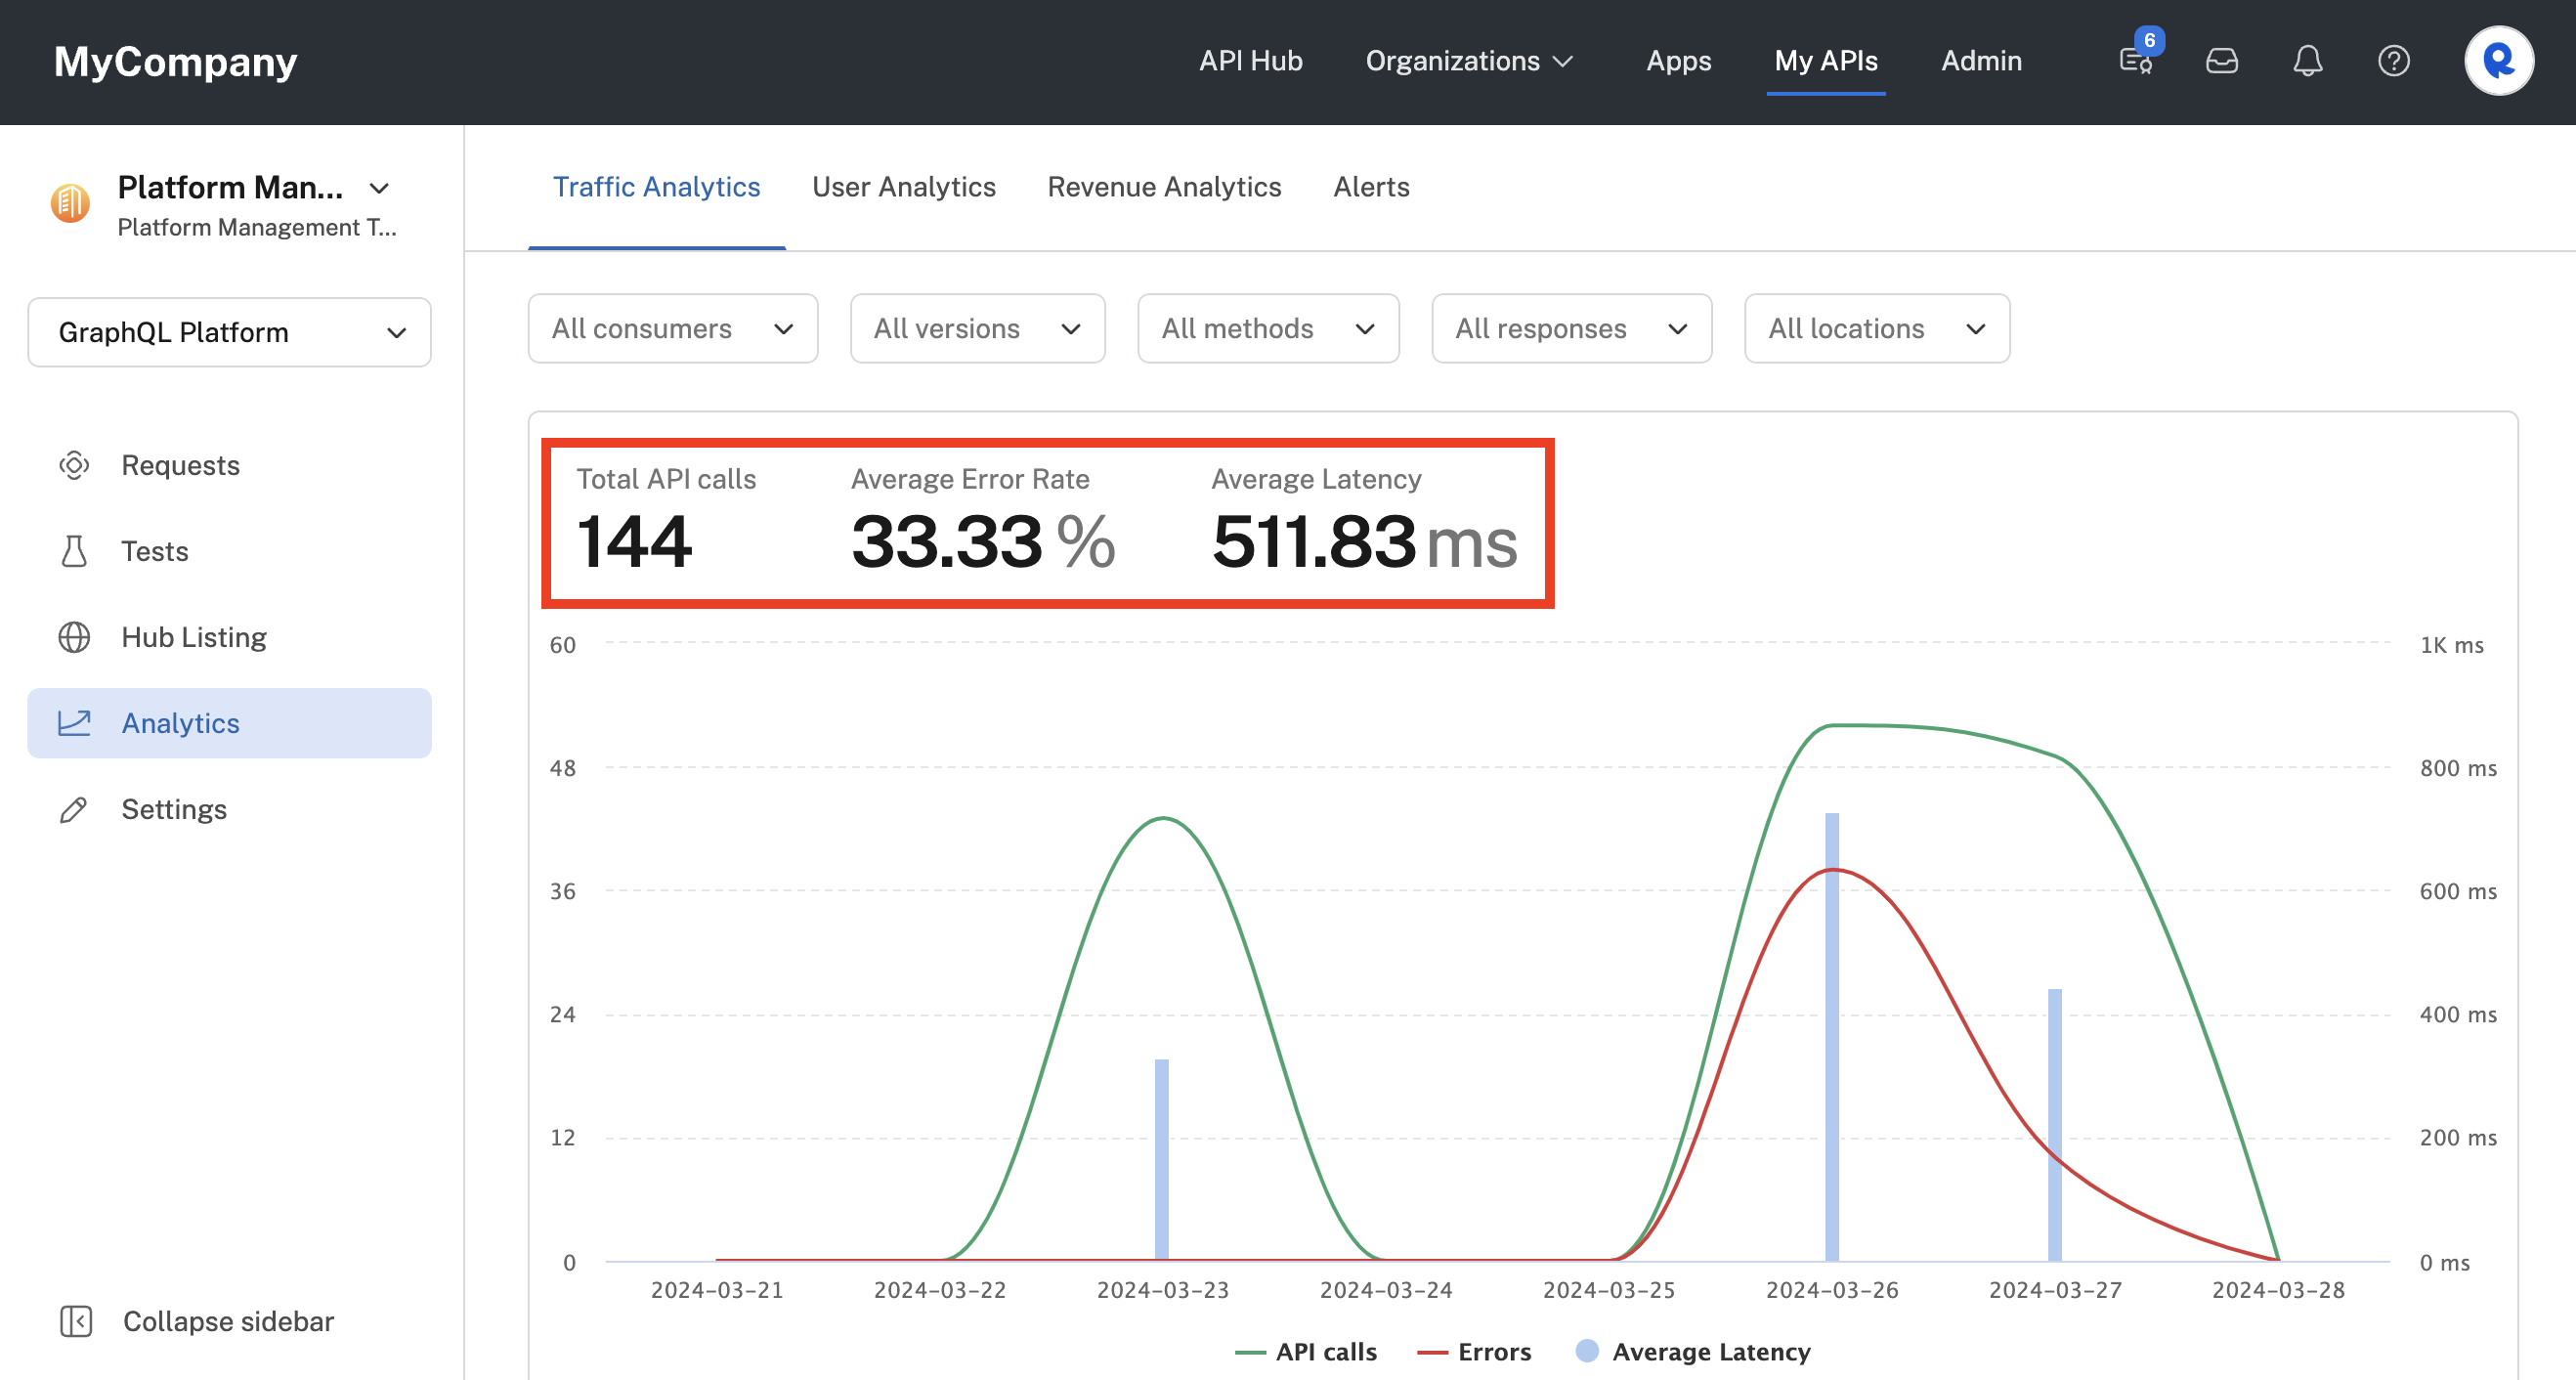
The apiTrafficAnalyticsSummary query is used to display aggregate analytics in Studio and in the Admin Panel.
query apiTrafficAnalyticsSummary($where: AnalyticsStatsInput!) {
  apiTrafficAnalyticsSummary(where: $where) {
    requests {
      total
      min
      max
      avg
      rps
      __typename
    }
    errors {
      total
      min
      max
      avg
      median
      __typename
    }
    latency {
      min
      max
      avg
      median
      __typename
    }
    __typename
  }
}
{
"where": {
"apiIds": [
"api_28f03d6e-955e-4f13-bed8-f574ff7530a2"
],
"fromDate": "2024-03-21T07:00:00.000Z",
"toDate": "2024-03-28T22:53:09.586Z",
"timeOffset": 0,
"resolution": "DAYS"
}
}{
"data": {
"apiTrafficAnalyticsSummary": {
"requests": {
"total": 144,
"min": 43,
"max": 52,
"avg": 20.571428571428573,
"rps": 0.00021752627309517227,
"__typename": "AnalyticsStatsSummaryRequests"
},
"errors": {
"total": 48,
"min": 0,
"max": 0.14285714285714285,
"avg": 0.3333333333333333,
"median": 0.1346153846153846,
"__typename": "AnalyticsStatsSummaryErrors"
},
"latency": {
"min": 57,
"max": 3245,
"avg": 511.8263888888889,
"median": 80,
"__typename": "AnalyticsStatsSummaryLatency"
},
"__typename": "AnalyticsStatsSummary"
}
}
}The following where variables of type apiTrafficAnalyticsSummary are supported. Many of these are used to filter the results for specific conditions.
| Name | Type | Required | Example |
|---|---|---|---|
| fromDate | DateTime | Yes | "2024-03-21", "2024-03-21T07:00:00.000Z" |
| toDate | DateTime | Yes | "2024-03-29", "2024-03-29T00:31:35.920Z" |
| resolution | String | Yes | “SECONDS”, “MINUTES”, "HOURS, “DAYS”, "MONTHS", "YEARS" |
| timeOffset | Int | No | 0 |
| apiIds | [ID] | No (default is all APIs) | ["api_04849dbb-4515-4dd3-899e-420e9af8076d", "api_05433514-c272-4a59-a4f1-6cd281032c1a"]["api_04849dbb-4515-4dd3-899e-420e9af8076d", "api_05433514-c272-4a59-a4f1-6cd281032c1a"] |
| projectIds (apps) | [ID] | No (default is all projectIds) | [“62c43f324ce2d82497981553”] For details on obtaining this value, see this page. The default means that calls from all apps by all consumers will be included, returning data for all calls made to the API(s) during the period (useful for API providers and admins). |
| consumerIds | [ID] | No (default is all consumerIds) | "consumerIds": [ "6028339" ] (user or team IDs) |
| endpointRoutes | [String] | No (default is all endpointRoutes) | ["apiendpoint_e564e317-3183-48a2-b02f-abeafc465d7b”]["apiendpoint_e564e317-3183-48a2-b02f-abeafc465d7b”] For details on obtaining this value, see this page. [] represents all endpoints. |
| endpointHashes | [ID] | No (default is all endpointHashes) | |
| gatewayIds | [ID] | No (default is all gatewayIds) | |
| apiVersionIds | [ID] | No (default is all apiVersionIds) | [ "apiversion_675afc63-3ba3-40b8-8b3e-4e972b5f254a" ][ "apiversion_675afc63-3ba3-40b8-8b3e-4e972b5f254a" ] |
| httpMethods | [String] | No (default is all httpMethods) | [ "GET", "POST", "PUT", "DELETE", "PATCH", "HEAD" ] |
| httpResponses | [AnalyticsStatsHttpResponseInput] | No (default is all httpResponses) | [ { "ge": 200, "lt": 300 } ][ { "ge": 200, "lt": 300 } ] (only includes 2XX responses) |
| originCountryNames | [String] | No (default is all originCountryNames) | [ "unknown country" ] |
API call volume, errors, and latency (apiTrafficAnalytics)
The GraphQL Platform API exposes a useful query named apiTrafficAnalytics for analyzing API call volume, errors, and latency. Unlike the apiTrafficAnalyticsSummary query (which returns only one set of data), the apiTrafficAnalytics query can return grouped data. You can filter and group the data by multiple dimensions including API, API version, app, and endpoint. The results are returned in a flat object that can easily be transformed into input for charting or pivot tables.
In order to only filter data by time you would use the "fromDate" and "toDate" fields. The "resolution" field is mandatory, so in order to get a single calculation for the entire period, make sure the resolution is larger than the date range.
This example returns all API traffic for the time period. Results are returned for each API and for each day (only for days where the API was consumed). Returning results by API ID is achieved using the groupBy argument in the query.
query apiTrafficAnalytics($where: AnalyticsStatsInput!) {
  apiTrafficAnalytics(where: $where, groupBy: {fields:API}) {
    date
    apiId
    requests
    latency
    errors
  }
}
{
"where": {
"fromDate": "2024-02-16T00:00:00.000Z",
"toDate": "2024-03-23T19:27:55.232Z",
"resolution": "DAYS"
}
}{
"data": {
"apiTrafficAnalytics": [
{
"date": "2024-03-23T00:00:00.000Z",
"apiId": "api_05433514-c272-4a59-a4f1-6cd281032c1a",
"requests": 1,
"latency": 1036,
"errors": 0
},
{
"date": "2024-03-23T00:00:00.000Z",
"apiId": "api_28f03d6e-955e-4f13-bed8-f574ff7530a2",
"requests": 29,
"latency": 265.13793103448273,
"errors": 0
}
]
}
}This example queries all APIs and aggregates the results for each day. Notice the groupBy argument from above has been removed.
query apiTrafficAnalytics($where: AnalyticsStatsInput!) {
  apiTrafficAnalytics(where: $where) {
    date
    requests
    latency
    errors
  }
}
{
"where": {
"fromDate": "2024-02-16T00:00:00.000Z",
"toDate": "2024-03-23T19:27:55.232Z",
"resolution": "DAYS"
}
}{
"data": {
"apiTrafficAnalytics": [
{
"date": "2024-03-22T00:00:00.000Z",
"requests": 1,
"latency": 1036,
"errors": 0
},
{
"date": "2024-03-23T00:00:00.000Z",
"requests": 29,
"latency": 265.13793103448273,
"errors": 0
}
]
}
}This example queries a specific set of APIs for a week and returns the results by apiId.
query apiTrafficAnalytics($where: AnalyticsStatsInput!) {
  apiTrafficAnalytics(where: $where, groupBy: {fields:API}) {
    date
    apiId
    requests
    latency
    errors
  }
}
{
"where": {
"fromDate": "2024-03-16T00:00:00.000Z",
"toDate": "2024-03-23T18:27:55.232Z",
"resolution": "DAYS",
"apiIds": [
"api_41a82ace-895f-4562-b52f-c50169e370",
"api_a2b7c737-9e49-4a6f-95ef-e39956dff2",
"api_0c5fde8c-edf3-44b2-b877-819108bf88"
]
}
}{
"data": {
"apiTrafficAnalytics": [
{
"date": "2024-02-20T00:00:00.000Z",
"apiId": "api_28f03d6e-955e-4f13-bed8-f574ff7530a2",
"requests": 4,
"latency": 233.5,
"errors": 2
},
{
"date": "2024-02-21T00:00:00.000Z",
"apiId": "api_28f03d6e-955e-4f13-bed8-f574ff7530a2",
"requests": 4,
"latency": 166.5,
"errors": 0
},
{
"date": "2024-02-25T00:00:00.000Z",
"apiId": "api_28f03d6e-955e-4f13-bed8-f574ff7530a2",
"requests": 16,
"latency": 196.0625,
"errors": 4
},
{
"date": "2024-02-26T00:00:00.000Z",
"apiId": "api_28f03d6e-955e-4f13-bed8-f574ff7530a2",
"requests": 2,
"latency": 361,
"errors": 1
},
{
"date": "2024-02-27T00:00:00.000Z",
"apiId": "api_28f03d6e-955e-4f13-bed8-f574ff7530a2",
"requests": 1,
"latency": 222,
"errors": 0
},
{
"date": "2024-02-28T00:00:00.000Z",
"apiId": "api_28f03d6e-955e-4f13-bed8-f574ff7530a2",
"requests": 1,
"latency": 109,
"errors": 0
},
{
"date": "2024-02-29T00:00:00.000Z",
"apiId": "api_28f03d6e-955e-4f13-bed8-f574ff7530a2",
"requests": 2,
"latency": 169.5,
"errors": 0
},
{
"date": "2024-03-02T00:00:00.000Z",
"apiId": "api_3facbf39-f9f9-4632-b0f3-2cfcf5de8004",
"requests": 9,
"latency": 40,
"errors": 2
},
{
"date": "2024-03-23T00:00:00.000Z",
"apiId": "api_28f03d6e-955e-4f13-bed8-f574ff7530a2",
"requests": 4,
"latency": 249.5,
"errors": 0
}
]
}
}
If you were to plot this result as a bar chart, it would look something like this:

We can use the same query to calculate trends in a very flexible manner. For example, let's adjust the query above in order to analyze the API traffic for each of these APIs, for each day, in order to get an better understanding of their trend. First, we should remove the redundant metrics (errors and latency). Next, we need to adjust the resolution from "YEARS" to "DAYS". Given that we are querying a week of data, we would expect 7 results for each API. The response will be a flat list of all data. Using a simple tool, we can convert the data to CSV and run a simple transpose in Excel. Here is an example of the request and response:
query apiTrafficAnalytics($where:AnalyticsStatsInput!){
  apiTrafficAnalytics(where:$where){
    date
    requests
    apiId
  }
}
{
"where": {
"fromDate": "2022-12-04",
"toDate": "2022-12-11",
"resolution": "DAYS",
"apiIds": [
"api_41a82ace-895f-4562-b52f-c50169e370",
"api_a2b7c737-9e49-4a6f-95ef-e39956dff2",
"api_0c5fde8c-edf3-44b2-b877-819108bf88"
]
}
}{
"data": {
"apiTrafficAnalytics": [
{
"date": "2022-12-04T00:00:00.000Z",
"requests": 2654,
"latency": 274.0097965335343,
"errors": 9,
"apiId": "api_a2b7c737-9e49-4a6f-95ef-e39956dff2"
},
{
"date": "2022-12-04T00:00:00.000Z",
"requests": 847,
"latency": 3732.099173553719,
"errors": 12,
"apiId": "api_0c5fde8c-edf3-44b2-b877-819108bf88"
},
{
"date": "2022-12-04T00:00:00.000Z",
"requests": 25614,
"latency": 669.6271179823534,
"errors": 1,
"apiId": "api_41a82ace-895f-4562-b52f-c50169e370"
},
{
"date": "2022-12-05T00:00:00.000Z",
"requests": 884,
"latency": 343.1165158371041,
"errors": 5,
"apiId": "api_0c5fde8c-edf3-44b2-b877-819108bf88"
},
{
"date": "2022-12-05T00:00:00.000Z",
"requests": 27691,
"latency": 680.3057311039688,
"errors": 10,
"apiId": "api_41a82ace-895f-4562-b52f-c50169e370"
},
{
"date": "2022-12-05T00:00:00.000Z",
"requests": 3152,
"latency": 342.35659898477155,
"errors": 8,
"apiId": "api_a2b7c737-9e49-4a6f-95ef-e39956dff2"
},
{
"date": "2022-12-06T00:00:00.000Z",
"requests": 1012,
"latency": 647.3330039525691,
"errors": 12,
"apiId": "api_0c5fde8c-edf3-44b2-b877-819108bf88"
},
{
"date": "2022-12-06T00:00:00.000Z",
"requests": 3445,
"latency": 303.84412191582004,
"errors": 11,
"apiId": "api_a2b7c737-9e49-4a6f-95ef-e39956dff2"
},
{
"date": "2022-12-06T00:00:00.000Z",
"requests": 32879,
"latency": 683.3744031144499,
"errors": 8,
"apiId": "api_41a82ace-895f-4562-b52f-c50169e370"
},
{
"date": "2022-12-07T00:00:00.000Z",
"requests": 29956,
"latency": 678.8020096141007,
"errors": 20,
"apiId": "api_41a82ace-895f-4562-b52f-c50169e370"
},
{
"date": "2022-12-07T00:00:00.000Z",
"requests": 1033,
"latency": 438.1490803484995,
"errors": 9,
"apiId": "api_0c5fde8c-edf3-44b2-b877-819108bf88"
},
{
"date": "2022-12-07T00:00:00.000Z",
"requests": 2342,
"latency": 324.3654995730145,
"errors": 41,
"apiId": "api_a2b7c737-9e49-4a6f-95ef-e39956dff2"
},
{
"date": "2022-12-08T00:00:00.000Z",
"requests": 2484,
"latency": 370.09863123993557,
"errors": 73,
"apiId": "api_a2b7c737-9e49-4a6f-95ef-e39956dff2"
},
{
"date": "2022-12-08T00:00:00.000Z",
"requests": 31880,
"latency": 693.655426599749,
"errors": 16,
"apiId": "api_41a82ace-895f-4562-b52f-c50169e370"
},
{
"date": "2022-12-08T00:00:00.000Z",
"requests": 1298,
"latency": 932.9352850539291,
"errors": 23,
"apiId": "api_0c5fde8c-edf3-44b2-b877-819108bf88"
},
{
"date": "2022-12-09T00:00:00.000Z",
"requests": 1697,
"latency": 352.7495580436064,
"errors": 5,
"apiId": "api_a2b7c737-9e49-4a6f-95ef-e39956dff2"
},
{
"date": "2022-12-09T00:00:00.000Z",
"requests": 897,
"latency": 468.1404682274248,
"errors": 7,
"apiId": "api_0c5fde8c-edf3-44b2-b877-819108bf88"
},
{
"date": "2022-12-09T00:00:00.000Z",
"requests": 32270,
"latency": 737.7004648280137,
"errors": 17,
"apiId": "api_41a82ace-895f-4562-b52f-c50169e370"
},
{
"date": "2022-12-10T00:00:00.000Z",
"requests": 486,
"latency": 422.66460905349794,
"errors": 10,
"apiId": "api_0c5fde8c-edf3-44b2-b877-819108bf88"
},
{
"date": "2022-12-10T00:00:00.000Z",
"requests": 2812,
"latency": 295.92603129445234,
"errors": 39,
"apiId": "api_a2b7c737-9e49-4a6f-95ef-e39956dff2"
},
{
"date": "2022-12-10T00:00:00.000Z",
"requests": 40837,
"latency": 670.9999510248059,
"errors": 17,
"apiId": "api_41a82ace-895f-4562-b52f-c50169e370"
},
{
"date": "2022-12-11T00:00:00.000Z",
"requests": 351,
"latency": 973.9373219373219,
"errors": 8,
"apiId": "api_0c5fde8c-edf3-44b2-b877-819108bf88"
},
{
"date": "2022-12-11T00:00:00.000Z",
"requests": 23515,
"latency": 673.0310865405061,
"errors": 2,
"apiId": "api_41a82ace-895f-4562-b52f-c50169e370"
},
{
"date": "2022-12-11T00:00:00.000Z",
"requests": 1934,
"latency": 294.81540847983456,
"errors": 68,
"apiId": "api_a2b7c737-9e49-4a6f-95ef-e39956dff2"
}
]
}
}date,api_0c5fde8c-edf3-44b2-b877-819108bf88,api_41a82ace-895f-4562-b52f-c50169e370,api_a2b7c737-9e49-4a6f-95ef-e39956dff2
2022-12-04T00:00:00.000Z,847,25614,2654
2022-12-05T00:00:00.000Z,884,27691,3152
2022-12-06T00:00:00.000Z,1012,32879,3445
2022-12-07T00:00:00.000Z,1033,29956,2342
2022-12-08T00:00:00.000Z,1298,31880,2484
2022-12-09T00:00:00.000Z,897,32270,1697
2022-12-10T00:00:00.000Z,486,40837,2812
2022-12-11T00:00:00.000Z,351,23515,1934We can now plot this data and create a multi-series line chart.

Let's consider an artificially complex scenario, and go through how we could implement it by exporting the raw data and creating a Google sheets pivot table. We want to review the method in which we visualize the maximum latency for each project (application) on each API on a daily basis for a given week.
Let's first create our query and add the needed dimensions API, Project and Date to the "response parameters" and "group by" filter input. We will use the same date range and APIs used in the previous example. We can see the request below but did not add the response as it is over 1700 items long.
{
	"query": "query apiTrafficAnalytics($where:AnalyticsStatsInput!){apiTrafficAnalytics(where:$where){date requests latency errors apiId appMashapeId}}",
	"variables":
}
{
"where": {
"fromDate": "2022-12-04",
"toDate": "2022-12-11T15:24:17.689Z",
"resolution": "DAYS",
"groupBy": [
"API",
"APP"
],
"apiIds": [
"api_41a82ace-895f-4562-b52f-c50169e370",
"api_a2b7c737-9e49-4a6f-95ef-e39956dff2",
"api_0c5fde8c-edf3-44b2-b877-819108bf88"
]
}
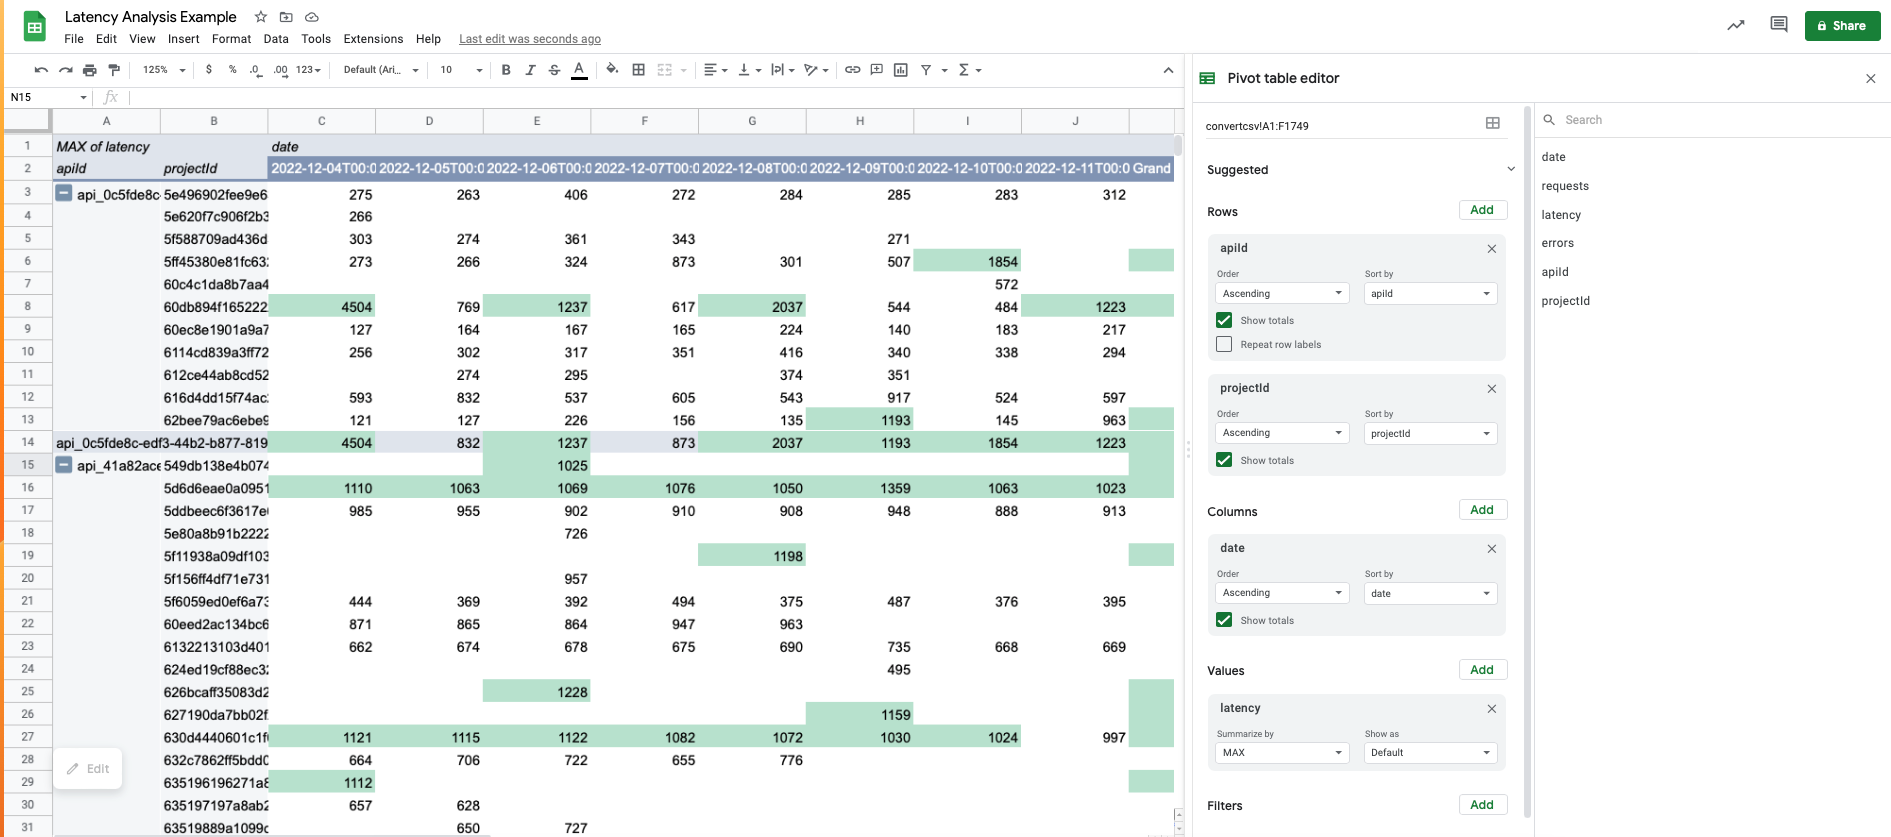
}We can convert converted the result to CSV rows using this tool. Once it is in Google sheets as raw row data we can create a pivot table and set it up as follows. A formatting rule was added to highlight all cells that have a value of over 1 second.
Through the where object, we can filter the results based on
- Time
- API IDs
These are the dimensions you can use to group the results by. Don't forget to add the dimension as a result parameter, or else you might mistake objects for being duplicates.
| Name | Type | Examples |
|---|---|---|
| apiIds | [string] | [] |
| fromDate | string | "2022-12-11", "2022-12-11T15:24:17.689Z" |
| toDate | string | "2022-12-11", "2022-12-11T15:24:17.689Z" |
| resolution | ENUM | SECONDS, MINUTES, HOURS, DAYS, MONTHS, YEARS |
| groupBy | ENUM | API, ENDPOINT, ENDPOINT_HASH, APP, API_VERSION, DATE |
Obtain request details by facet (apiTrafficAnalyticsFacets)
Here a facet means a definable aspect of a request. For example, a request uses an HTTP method, so HTTP method can be considered a facet. Another example of a facet is the API consumer who made the request.
The apiTrafficAnalyticsFacets query is used to return, for a given time period, aggregate numbers and related details related to facets of requests. The related details include endpoints that were called, API consumers, versions used, HTTP methods called, HTTP responses, and locations.
The query is very flexible because it can return data for the entire Enterprise Hub, or can be filtered by API, app, API consumer, endpoint, version, HTTP method, HTTP response, and country of request origin (see the table of where values below).
This query is used behind the scened when displaying aggregate request information and details in the Analytics tab in Studio and in the APIs Admin Panel (an example shown in the diagram below). Notice that the user interface below includes the ability to filter the returned data by time, endpoints, the API consumer, version, HTTP method, etc.
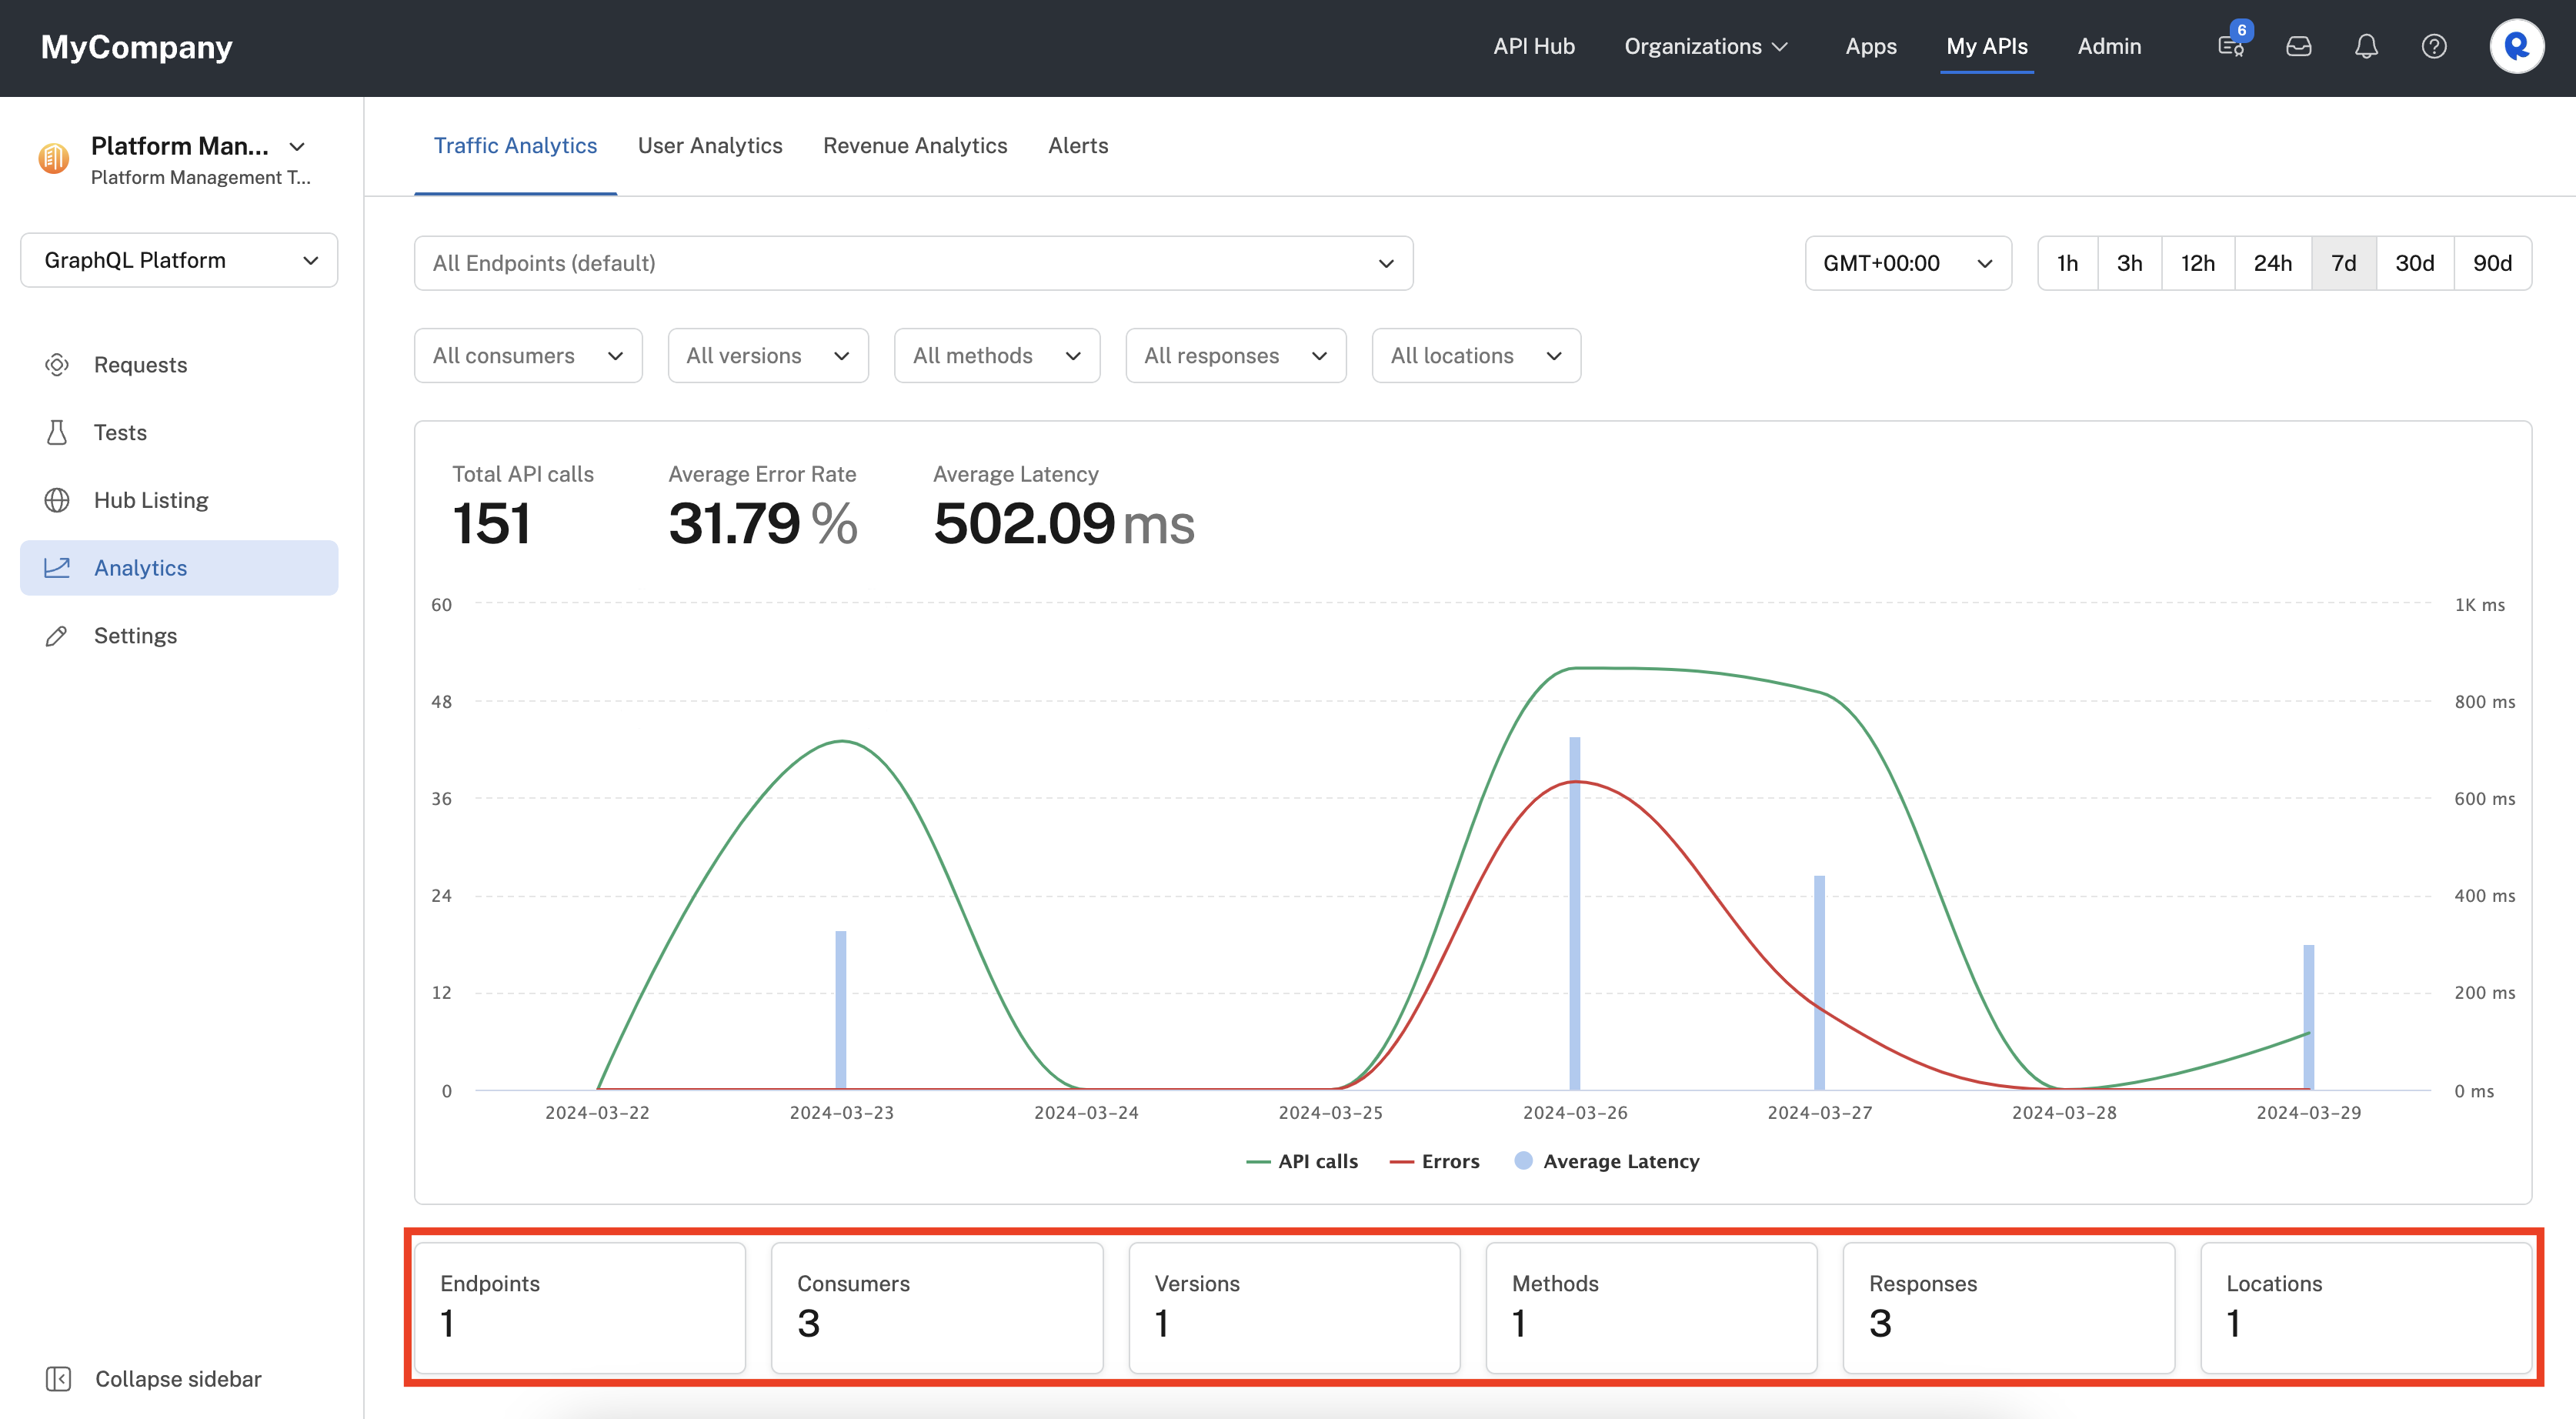
The apiTrafficAnalyticsFacets query is used to display this data, and the details that appears when you click on them.
query apiTrafficAnalyticsFacets($where: AnalyticsFacetsInput!) {
  apiTrafficAnalyticsFacets(where: $where) {
    consumers {
      data {
        consumer {
          id
          name
          username
          slugifiedName
          thumbnail
          __typename
        }
        requests
        __typename
      }
      total
      __typename
    }
    countryNames {
      data {
        country
        requests
        __typename
      }
      total
      __typename
    }
    methods {
      data {
        method
        requests
        __typename
      }
      total
      __typename
    }
    httpStatuses {
      data {
        status
        requests
        __typename
      }
      total
      __typename
    }
    apiVersions {
      data {
        apiVersion {
          id
          name
          __typename
        }
        requests
        __typename
      }
      total
      __typename
    }
    endpoints {
      data {
        endpoint {
          id
          endpointHash
          route
          __typename
        }
        requests
        __typename
      }
      total
      __typename
    }
    __typename
  }
}
{
"where": {
"apiIds": [
"api_28f03d6e-955e-4f13-bed8-f574ff7530a2"
],
"fromDate": "2024-03-22T07:00:00.000Z",
"toDate": "2024-03-29T21:37:06.457Z"
}
}{
"data": {
"apiTrafficAnalyticsFacets": {
"consumers": {
"data": [
{
"consumer": {
"id": "5713300",
"name": "sbyrnes",
"username": null,
"slugifiedName": "sbyrnes",
"thumbnail": "https://s3.amazonaws.com/rapidapi-prod-user/d5a69b00-1eee-44b4-b33d-446e987d3c7b",
"__typename": "Entity"
},
"requests": 135,
"__typename": "ConsumerFacet"
},
{
"consumer": {
"id": "5755579",
"name": "Team A1",
"username": null,
"slugifiedName": "org-a1-org-a-default",
"thumbnail": "https://rapidapi-prod-collections.s3.amazonaws.com/team/38cad62e-c8aa-45d2-a650-0426f387c9f3.png",
"__typename": "Entity"
},
"requests": 10,
"__typename": "ConsumerFacet"
},
{
"consumer": {
"id": "5739168",
"name": "Platform Management Team 1",
"username": null,
"slugifiedName": "platform-management-platform-management-default",
"thumbnail": null,
"__typename": "Entity"
},
"requests": 6,
"__typename": "ConsumerFacet"
}
],
"total": 3,
"__typename": "ConsumerFacetGroup"
},
"countryNames": {
"data": [
{
"country": "United States",
"requests": 151,
"__typename": "CountryNameFacet"
}
],
"total": 1,
"__typename": "CountryNameFacetGroup"
},
"methods": {
"data": [
{
"method": "POST",
"requests": 151,
"__typename": "MethodFacet"
}
],
"total": 1,
"__typename": "MethodFacetGroup"
},
"httpStatuses": {
"data": [
{
"status": 200,
"requests": 103,
"__typename": "StatusFacet"
},
{
"status": 400,
"requests": 47,
"__typename": "StatusFacet"
},
{
"status": 500,
"requests": 1,
"__typename": "StatusFacet"
}
],
"total": 3,
"__typename": "HttpStatusFacetGroup"
},
"apiVersions": {
"data": [
{
"apiVersion": {
"id": "apiversion_675afc63-3ba3-40b8-8b3e-4e972b5f254a",
"name": "v1",
"__typename": "ApiVersion"
},
"requests": 151,
"__typename": "ApiVersionFacet"
}
],
"total": 1,
"__typename": "ApiVersionFacetGroup"
},
"endpoints": {
"data": [
{
"endpoint": {
"id": "apiendpoint_37adc863-e838-45d5-ae73-d87007fcac93",
"endpointHash": "bb922c77879992716869058036739e00",
"route": "/",
"__typename": "Endpoint"
},
"requests": 151,
"__typename": "EndpointFacet"
}
],
"total": 1,
"__typename": "EndpointFacetGroup"
},
"__typename": "AnalyticsStatsFacets"
}
}
}The following where variables of type AnalyticsFacetsInput are supported. Many of these are used to filter the results for specific conditions.
| Name | Type | Required | Example |
|---|---|---|---|
| fromDate | DateTime | Yes | "2024-03-21", "2024-03-21T07:00:00.000Z" |
| toDate | DateTime | Yes | "2024-03-29", "2024-03-29T00:31:35.920Z" |
| apiIds | [ID] | No (default is all APIs) | ["api_04849dbb-4515-4dd3-899e-420e9af8076d", "api_05433514-c272-4a59-a4f1-6cd281032c1a"]["api_04849dbb-4515-4dd3-899e-420e9af8076d", "api_05433514-c272-4a59-a4f1-6cd281032c1a"] |
| projectIds (apps) | [ID] | No (default is all projectIds) | [“62c43f324ce2d82497981553”] For details on obtaining this value, see this page. The default means that calls from all apps by all consumers will be included, returning data for all calls made to the API(s) during the period (useful for API providers and admins). |
| consumerIds | [ID] | No (default is all consumerIds) | "consumerIds": [ "6028339" ] (user or team IDs) |
| endpointRoutes | [String] | No (default is all endpointRoutes) | ["apiendpoint_e564e317-3183-48a2-b02f-abeafc465d7b”]["apiendpoint_e564e317-3183-48a2-b02f-abeafc465d7b”] For details on obtaining this value, see this page. [] represents all endpoints. |
| endpointHashes | [ID] | No (default is all endpointHashes) | |
| endpointIds | [ID] | No (default is all endpointIds) | |
| gatewayIds | [ID] | No (default is all gatewayIds) | |
| apiVersionIds | [ID] | No (default is all apiVersionIds) | [ "apiversion_675afc63-3ba3-40b8-8b3e-4e972b5f254a" ][ "apiversion_675afc63-3ba3-40b8-8b3e-4e972b5f254a" ] |
| httpMethods | [String] | No (default is all httpMethods) | [ "GET", "POST", "PUT", "DELETE", "PATCH", "HEAD" ] |
| httpResponses | [AnalyticsStatsHttpResponseInput] | No (default is all httpResponses) | [ { "ge": 200, "lt": 300 } ][ { "ge": 200, "lt": 300 } ] (only includes 2XX responses) |
| originCountryNames | [String] | No (default is all originCountryNames) | [ "unknown country" ] |
Obtain aggregated usage statistics (calculatedStatistics)
Using apiTrafficAnalyticsSummary query is usually recommendedThe
calculatedStatisticsquery described here is similar to theapiTrafficAnalyticsSummaryquery described at the top of this page. TheapiTrafficAnalyticsSummaryquery is usually recommended, because it can be filtered in more ways.
The GraphQL Platform API exposes a useful query, named calculatedStatistics, for extracting the aggregated API call volume, errors, and latency for a given period of time. In the Hub, this endpoint is used to build the analytics widget statistics on top of the line chart found in the Developer Dashboard (Apps). It could also be used to provide aggregated statistics useful to API providers and admins.

The calculatedStatistics query is used to populate this data in the Developer Dashboard (Apps).
Here is an example of querying statistics for the last 30 days, with a daily resolution, for all API IDs, for all endpoints, and for all API consumers. The third tab demonstrates what the response for such a query would look like.
query calculatedStatistics($apiIds: [String]!, $fromDate: String!, $toDate: String!, $resolution: String, $timeOffset: Int) {
	calculatedStatistics(apiIds: $apiIds  fromDate: $fromDate toDate: $toDate resolution: $resolution timeOffset: $timeOffset) {
		requeststotal
		requestsmax
		requestsmin
		requestsavg
		requeststps
		errorsavg
		errorsmedian
		errorsmax
		errorsmin
		errorstotal
		latencyavg
		latencymedian
		latencymax
		latencymin
	}
}
{
"apiIds": [""],
"fromDate": "2022-12-06T08:06:18.548Z",
"toDate": "2023-01-05T08:06:18.549Z",
"resolution": "days",
"timeOffset": 0
}{
"data": {
"calculatedStatistics": {
"requeststotal": 2735996208,
"requestsmax": 127399610,
"requestsmin": 40089284,
"requestsavg": 91199873.6,
"requeststps": 1055.55,
"errorsavg": 0.03,
"errorsmedian": 0.03,
"errorsmax": 0.06,
"errorsmin": 0.02,
"errorstotal": 84327307,
"latencyavg": 1203.03,
"latencymedian": 486,
"latencymax": 75919269,
"latencymin": 0,
}
}
}Results can be filtered by:
- API
- Endpoint
- App
The following variables are supported:
| Name | Type | Mandatory | Example |
|---|---|---|---|
| apiIds | [string] | Yes (though "" represents all APIs) | [""] ["api_04849dbb-4515-4dd3-899e-420e9af8076d", "api_05433514-c272-4a59-a4f1-6cd281032c1a"]["api_04849dbb-4515-4dd3-899e-420e9af8076d", "api_05433514-c272-4a59-a4f1-6cd281032c1a"] |
| fromDate | string | Yes | "2022-12-06", "2022-12-06T08:06:18.548Z" |
| toDate | string | Yes | "2023-01-05", "2023-01-05T08:06:18.549Z" |
| resolution | enum | No (defaults to "minutes") | “seconds”, “minutes”, "hours”, “days” |
| projectIds (apps) | [string] | No | [“62c43f324ce2d82497981553”] For details on obtaining this value, see this page. A value of [] means that calls from all apps by all consumers will be included, returning data for all calls made to the API(s) during the period (useful for API providers and admins). |
| endpoints | [string] | No | ["apiendpoint_e564e317-3183-48a2-b02f-abeafc465d7b”]["apiendpoint_e564e317-3183-48a2-b02f-abeafc465d7b”] For details on obtaining this value, see this page. [] represents all endpoints. |
Given a date range and resolution, the API response can include the following statistics:
| Aggregation | Volume | Errors | Latency |
|---|---|---|---|
| Total | The total number of requests (requeststotal) within the $fromDate to $toDate range (this will always be the same, regardless of the resolution). | The total number of error responses (errorstotal) within the given date range (this will always be the same, regardless of the resolution). | Not applicable |
| Maximum | The maximum number of requests (requestsmax) during a single resolution window within the given date range. For example, in a one month date range with a resolution set to "day", this value represents the number of requests for the day of the month with the most requests. | The highest error rate (errorsmax) during a single resolution window within the given date range. For example, in a one month date range with a resolution set to "day", if the worst day of the month experienced an error rate of 30%, this value will be 0.3. | The API response with the highest latency (in milliseconds) (latencymax) within the given date range (this will always be the same, regardless of the resolution). |
| Minimum | The minimum number of requests (requestsmin) during a single resolution window within the given date range. For example, in a one month date range with a resolution set to "day", this value represents the number of requests for the day of the month with the least number of requests. | The lowest error rate (errorsmin) during a single resolution window within the given date range. For example, in a one month date range with a resolution set to "day", if the best day of the month experienced an error rate of 1%, this value will be 0.01. | The API response with the lowest latency (latencymin) within the given date range (this will always be the same, regardless of the resolution). |
| Average | The average number of requests (requestsavg) during a single resolution window within the given date range. For example, in a one month date range with a resolution set to "day", this value represents the average number of daily requests. | The ratio (errorsavg) obtained by dividing the errorstotal by the requeststotal for the given date range (this will always be the same, regardless of the resolution). Multiplying this value by 100 gives the percentage of requests for the date range that resulted in errors. | The average latency (latencyavg) in milliseconds for the given date range (this will always be the same, regardless of the resolution). |
| Median | Not applicable. | The median error rate (errorsmedian) during each resolution window within the given date range. For example, in a one month date range with a resolution set to "day", if half of the days had error rates above 5% and half had error rates below 5%, this value will be 0.05. | The median latency (latencymedian) in milliseconds for the given date range (this will always be the same, regardless of the resolution). |
Updated about 1 year ago