Managing APIs
Search for, view details of, and manage APIs.
The APIs tab
The APIs tab of the Admin Panel displays information (name owner, created, etc.) for all public and private APIs in your Enterprise Hub.
Click on the API's name to display details of the API.
Use the search box at the top of the page to search by API name, API ID, or owner ID.
Click on the filter icon next to Visibility to show only public or private APIs.
Click on the filter icon next to Category to show only APIs from one or more Categories.
Click the Created header to sort by the date the APIs were created.
Click on the three vertical dots in the last column associated with an API for convenient access to the API in the API Hub (the API consumer experience) or Studio (the API provider experience). If one or both of these items is grayed out, it means you do not have access to the API. Click Delete API to remove the API from the Enterprise Hub.
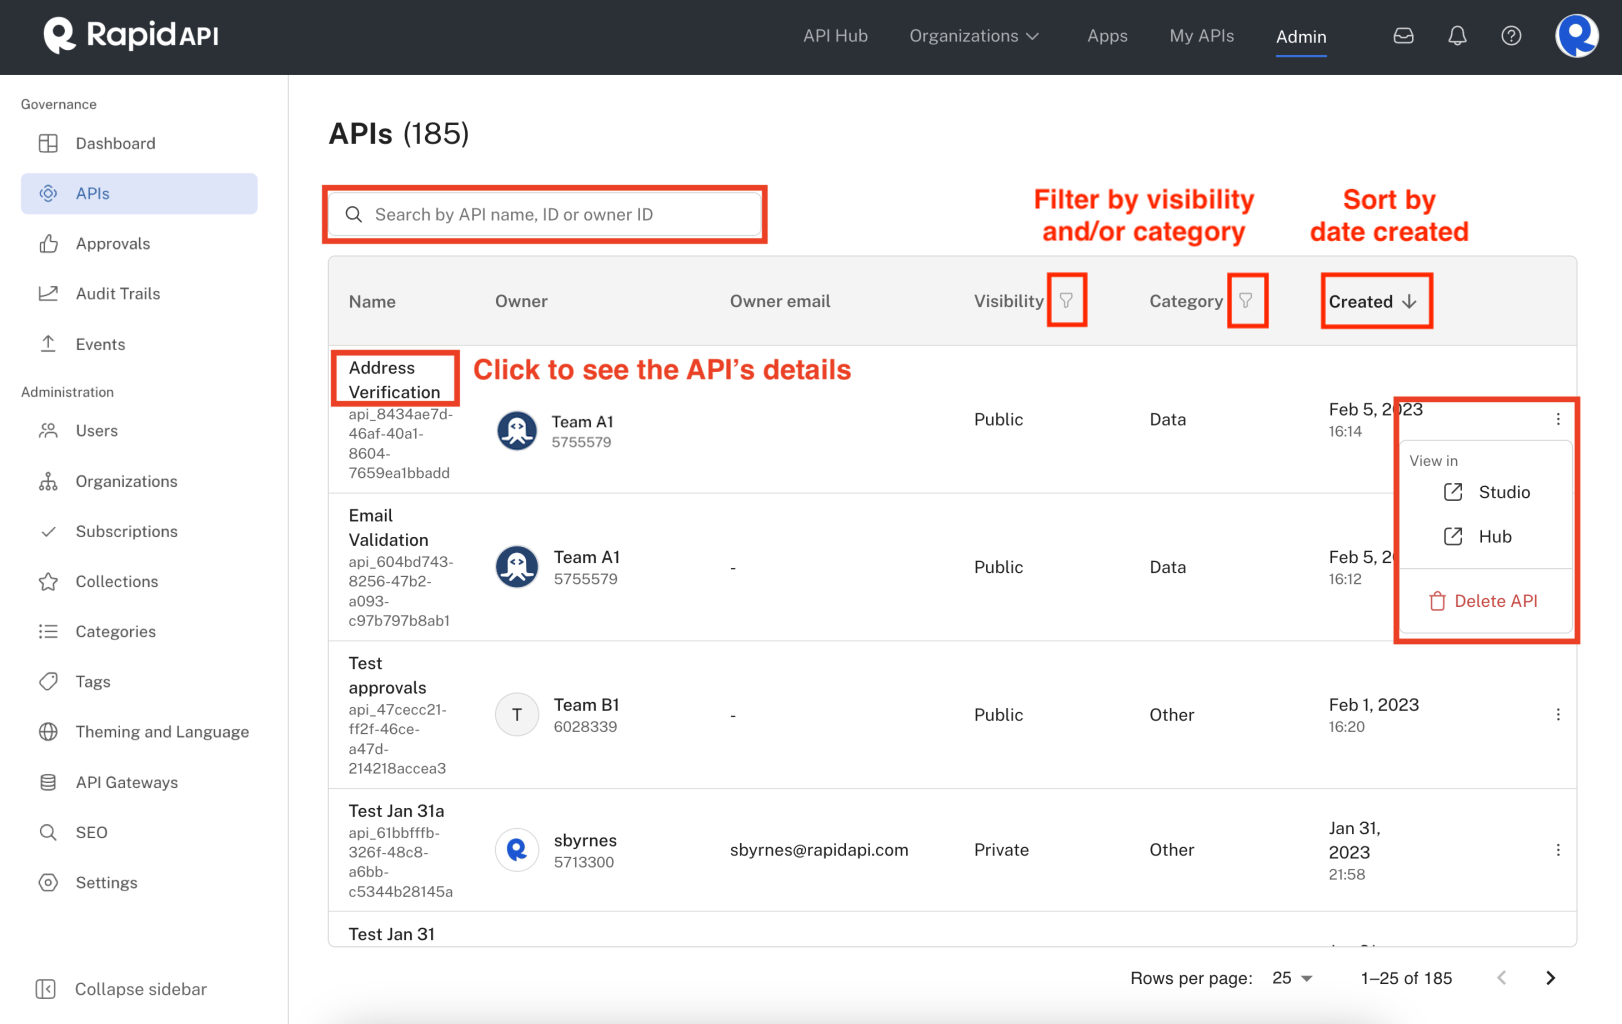
APIs tab in the Admin Panel.
To see more details of an API, click on the link in the Name or Owner column to open an overview page for the API.
API details: Overview tab
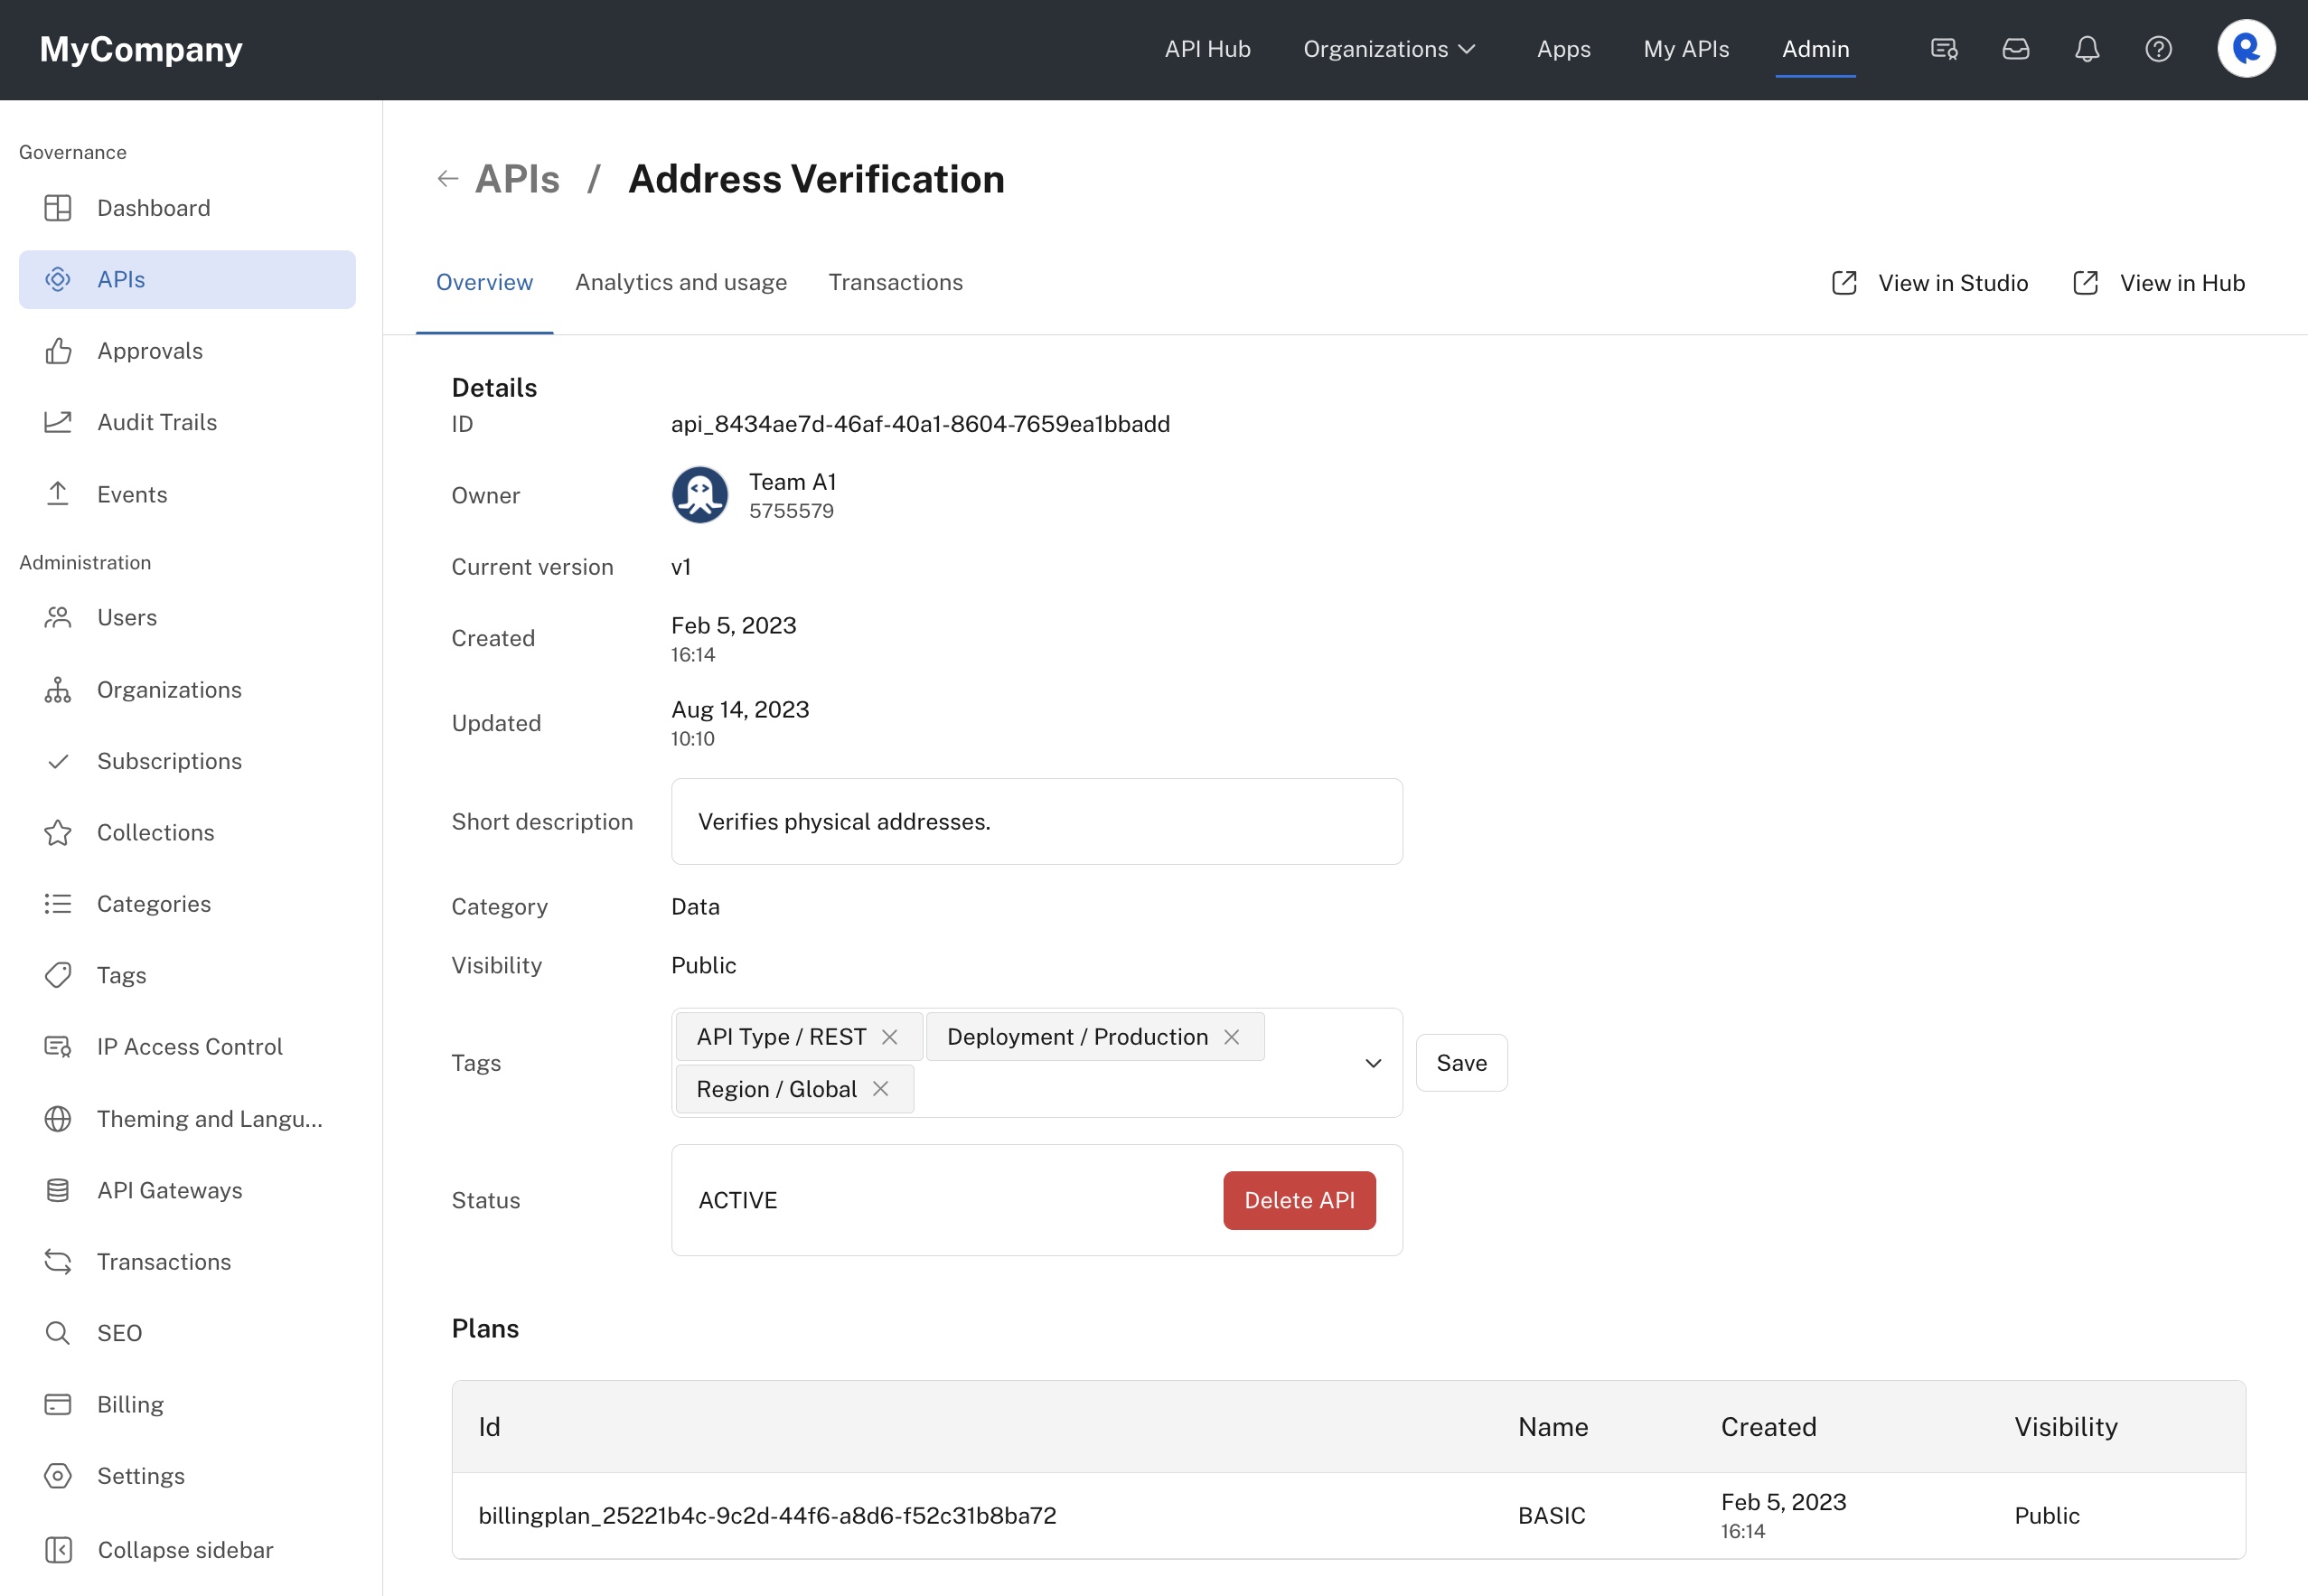
The Overview tab when viewing an API's details.
The Overview tab gives a high-level view of important information related to an API, such as its current version, last updated date, and any plans associated with the API. It also gives environment admins the ability to manage API tags and to delete the API.
Click on the View in Studio or View in Hub links in the upper right for convenient access to the API in Studio or the Hub (assuming you have access to the API).
API details: Analytics and usage tab
The Analytics and usage tab for an API is divided into three major sections.
At the top of the page, you are able to view call volume, error rate, and latency.
By default, you will see analytics for all endpoints. Click in box containing All endpoints to filter the results to specific endpoints.
You can further limit the information displayed by selecting one or more of the dropdown boxes under the All endpoints filter. You can limit the display to specific API consumers, API versions, HTTP methods, HTTP response codes and/or geographic locations (by country).
Click time period buttons in the upper right to change the timeframe of the displayed data.
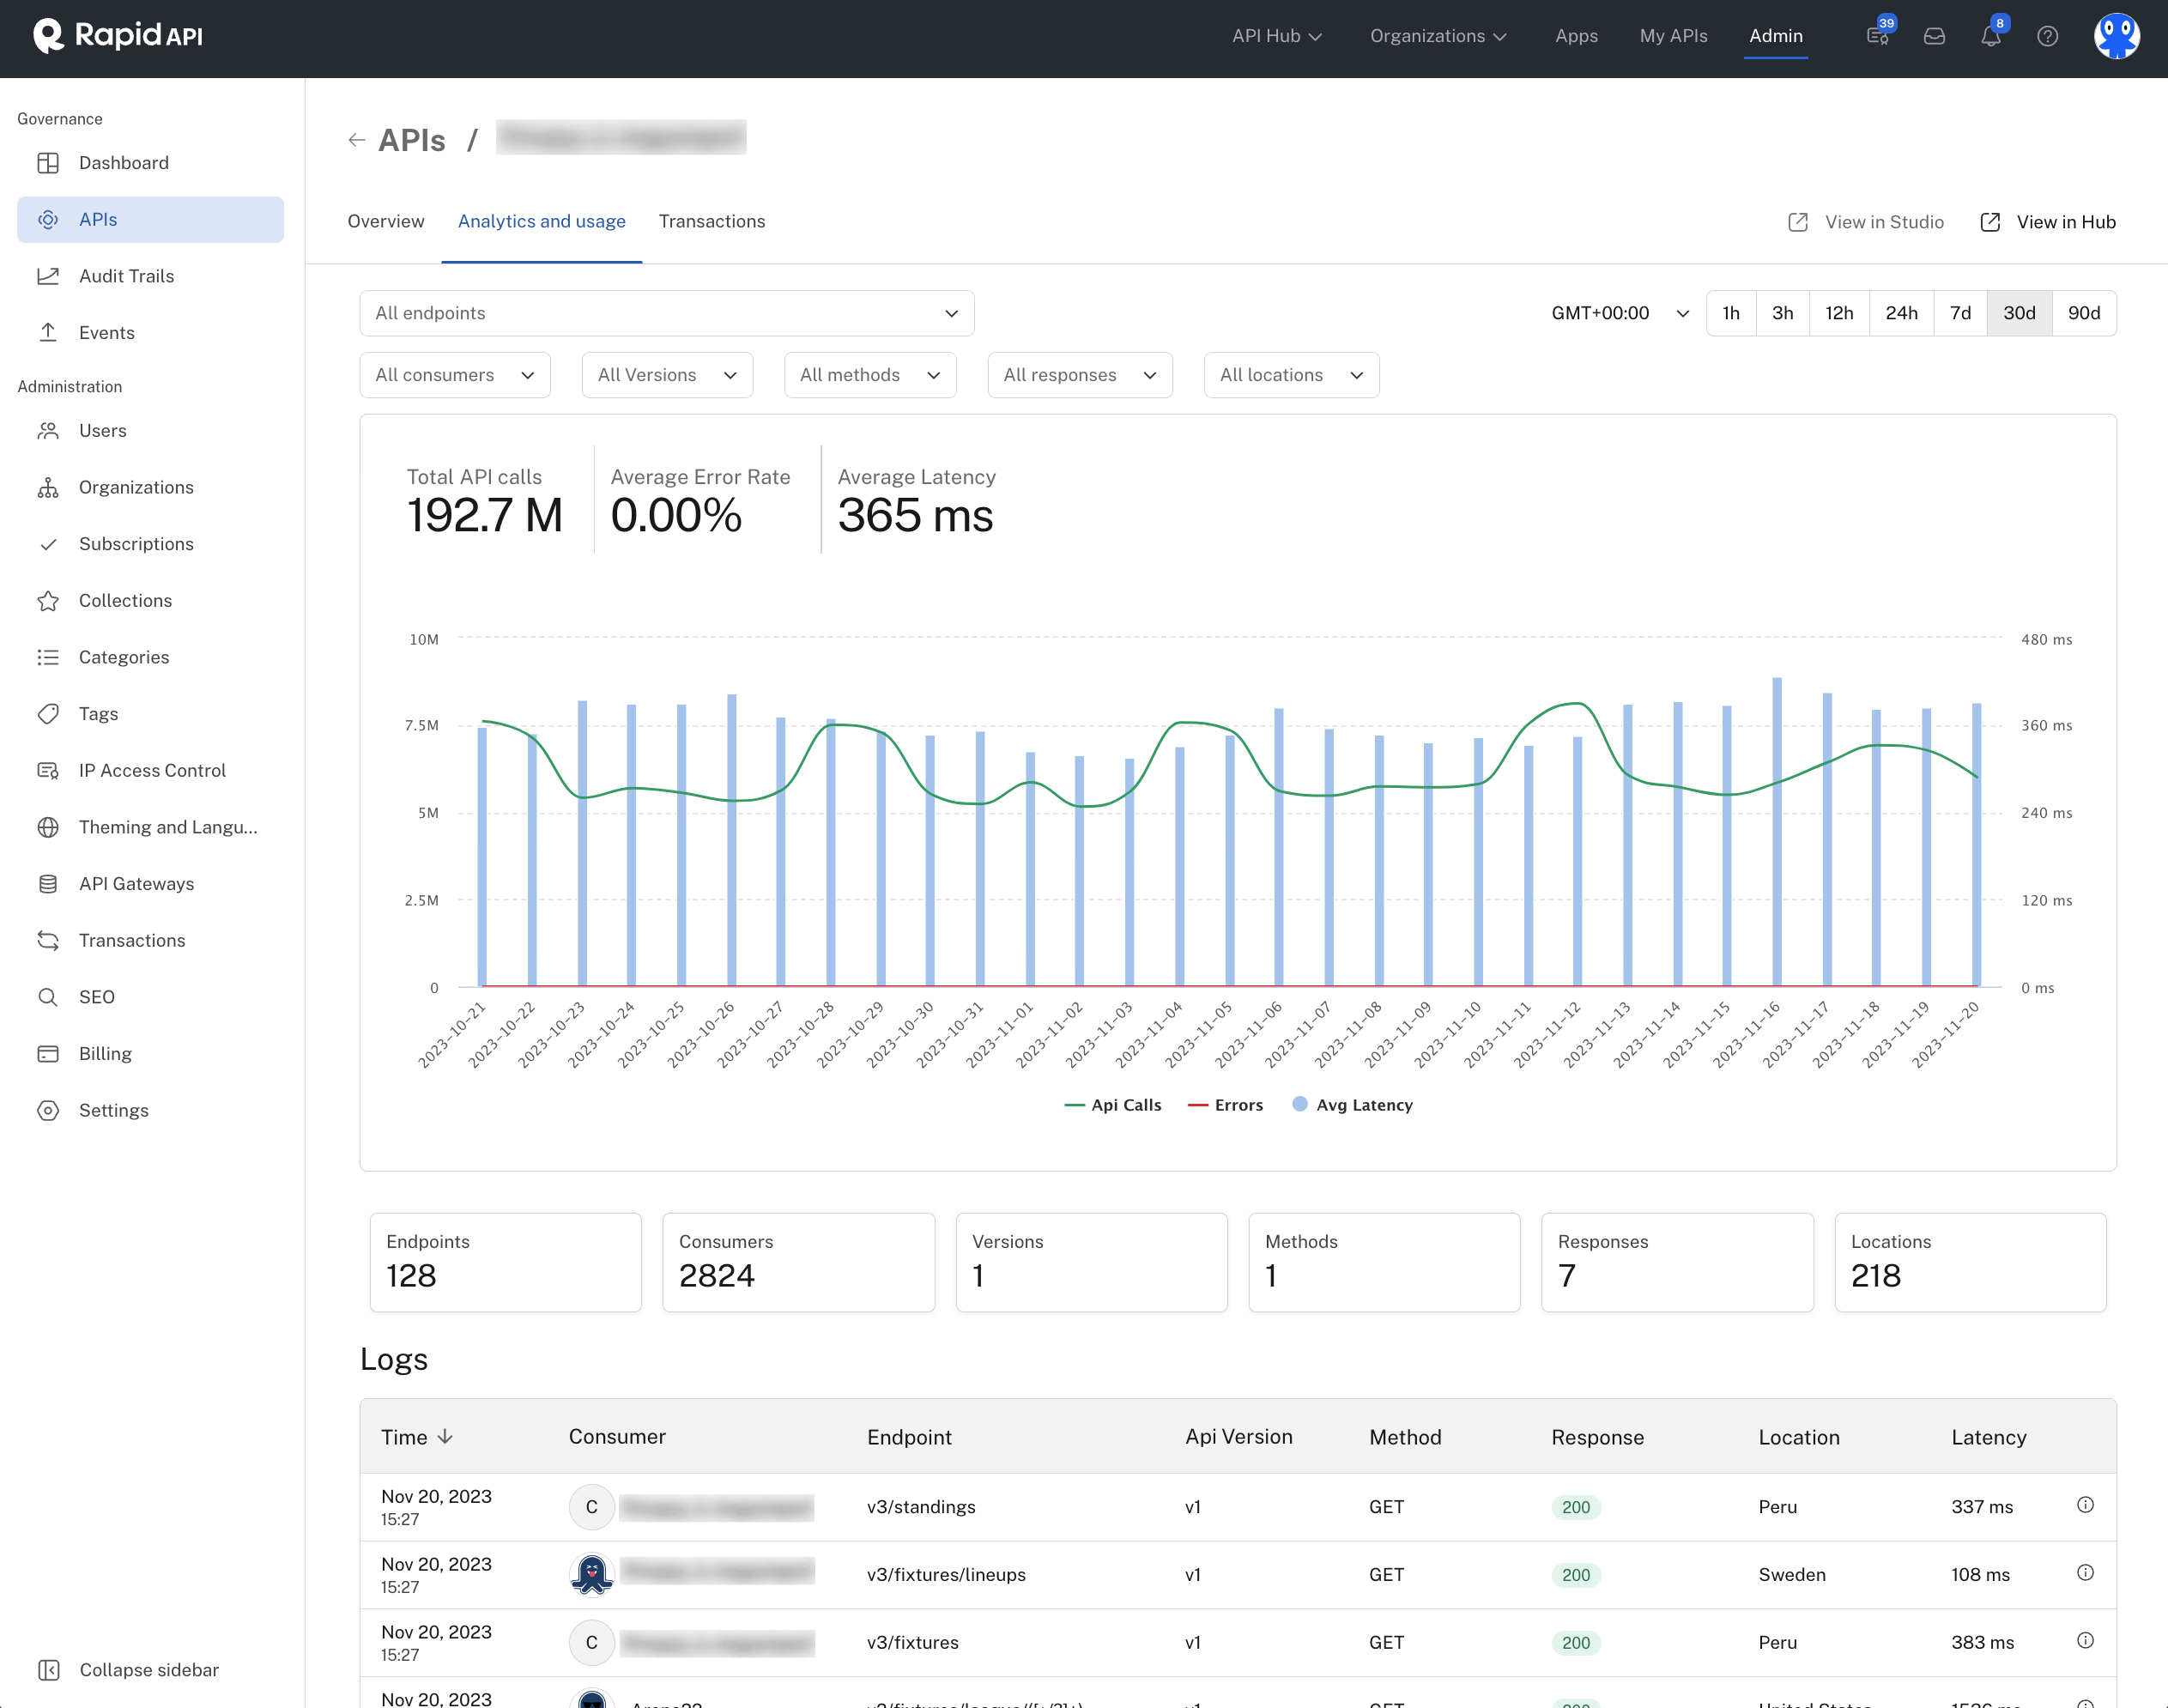
The Analytics and usage tab when viewing an API's details.
The second major section of the Analytics and usage tab is directly below the graph, and displays a row of informational boxes about the API. Here you can see the number of endpoints for the API, number of unique consumers, number of API versions, number of HTTP methods, number of unique HTTP response codes, and the number of unique countries from which API consumers were calling the API's endpoints.
Click on any of the boxes in that row to display more information in a popup window. For example, the screenshot below shows the popup that results from clicking the Locations box. Here you can see a breakdown of requests by country. In the last column, you can click Add to filter and the location will be added to the All locations dropdown above the graph (this was described above). This is a convenient way to filter the graph by location, consumer, endpoint, etc.
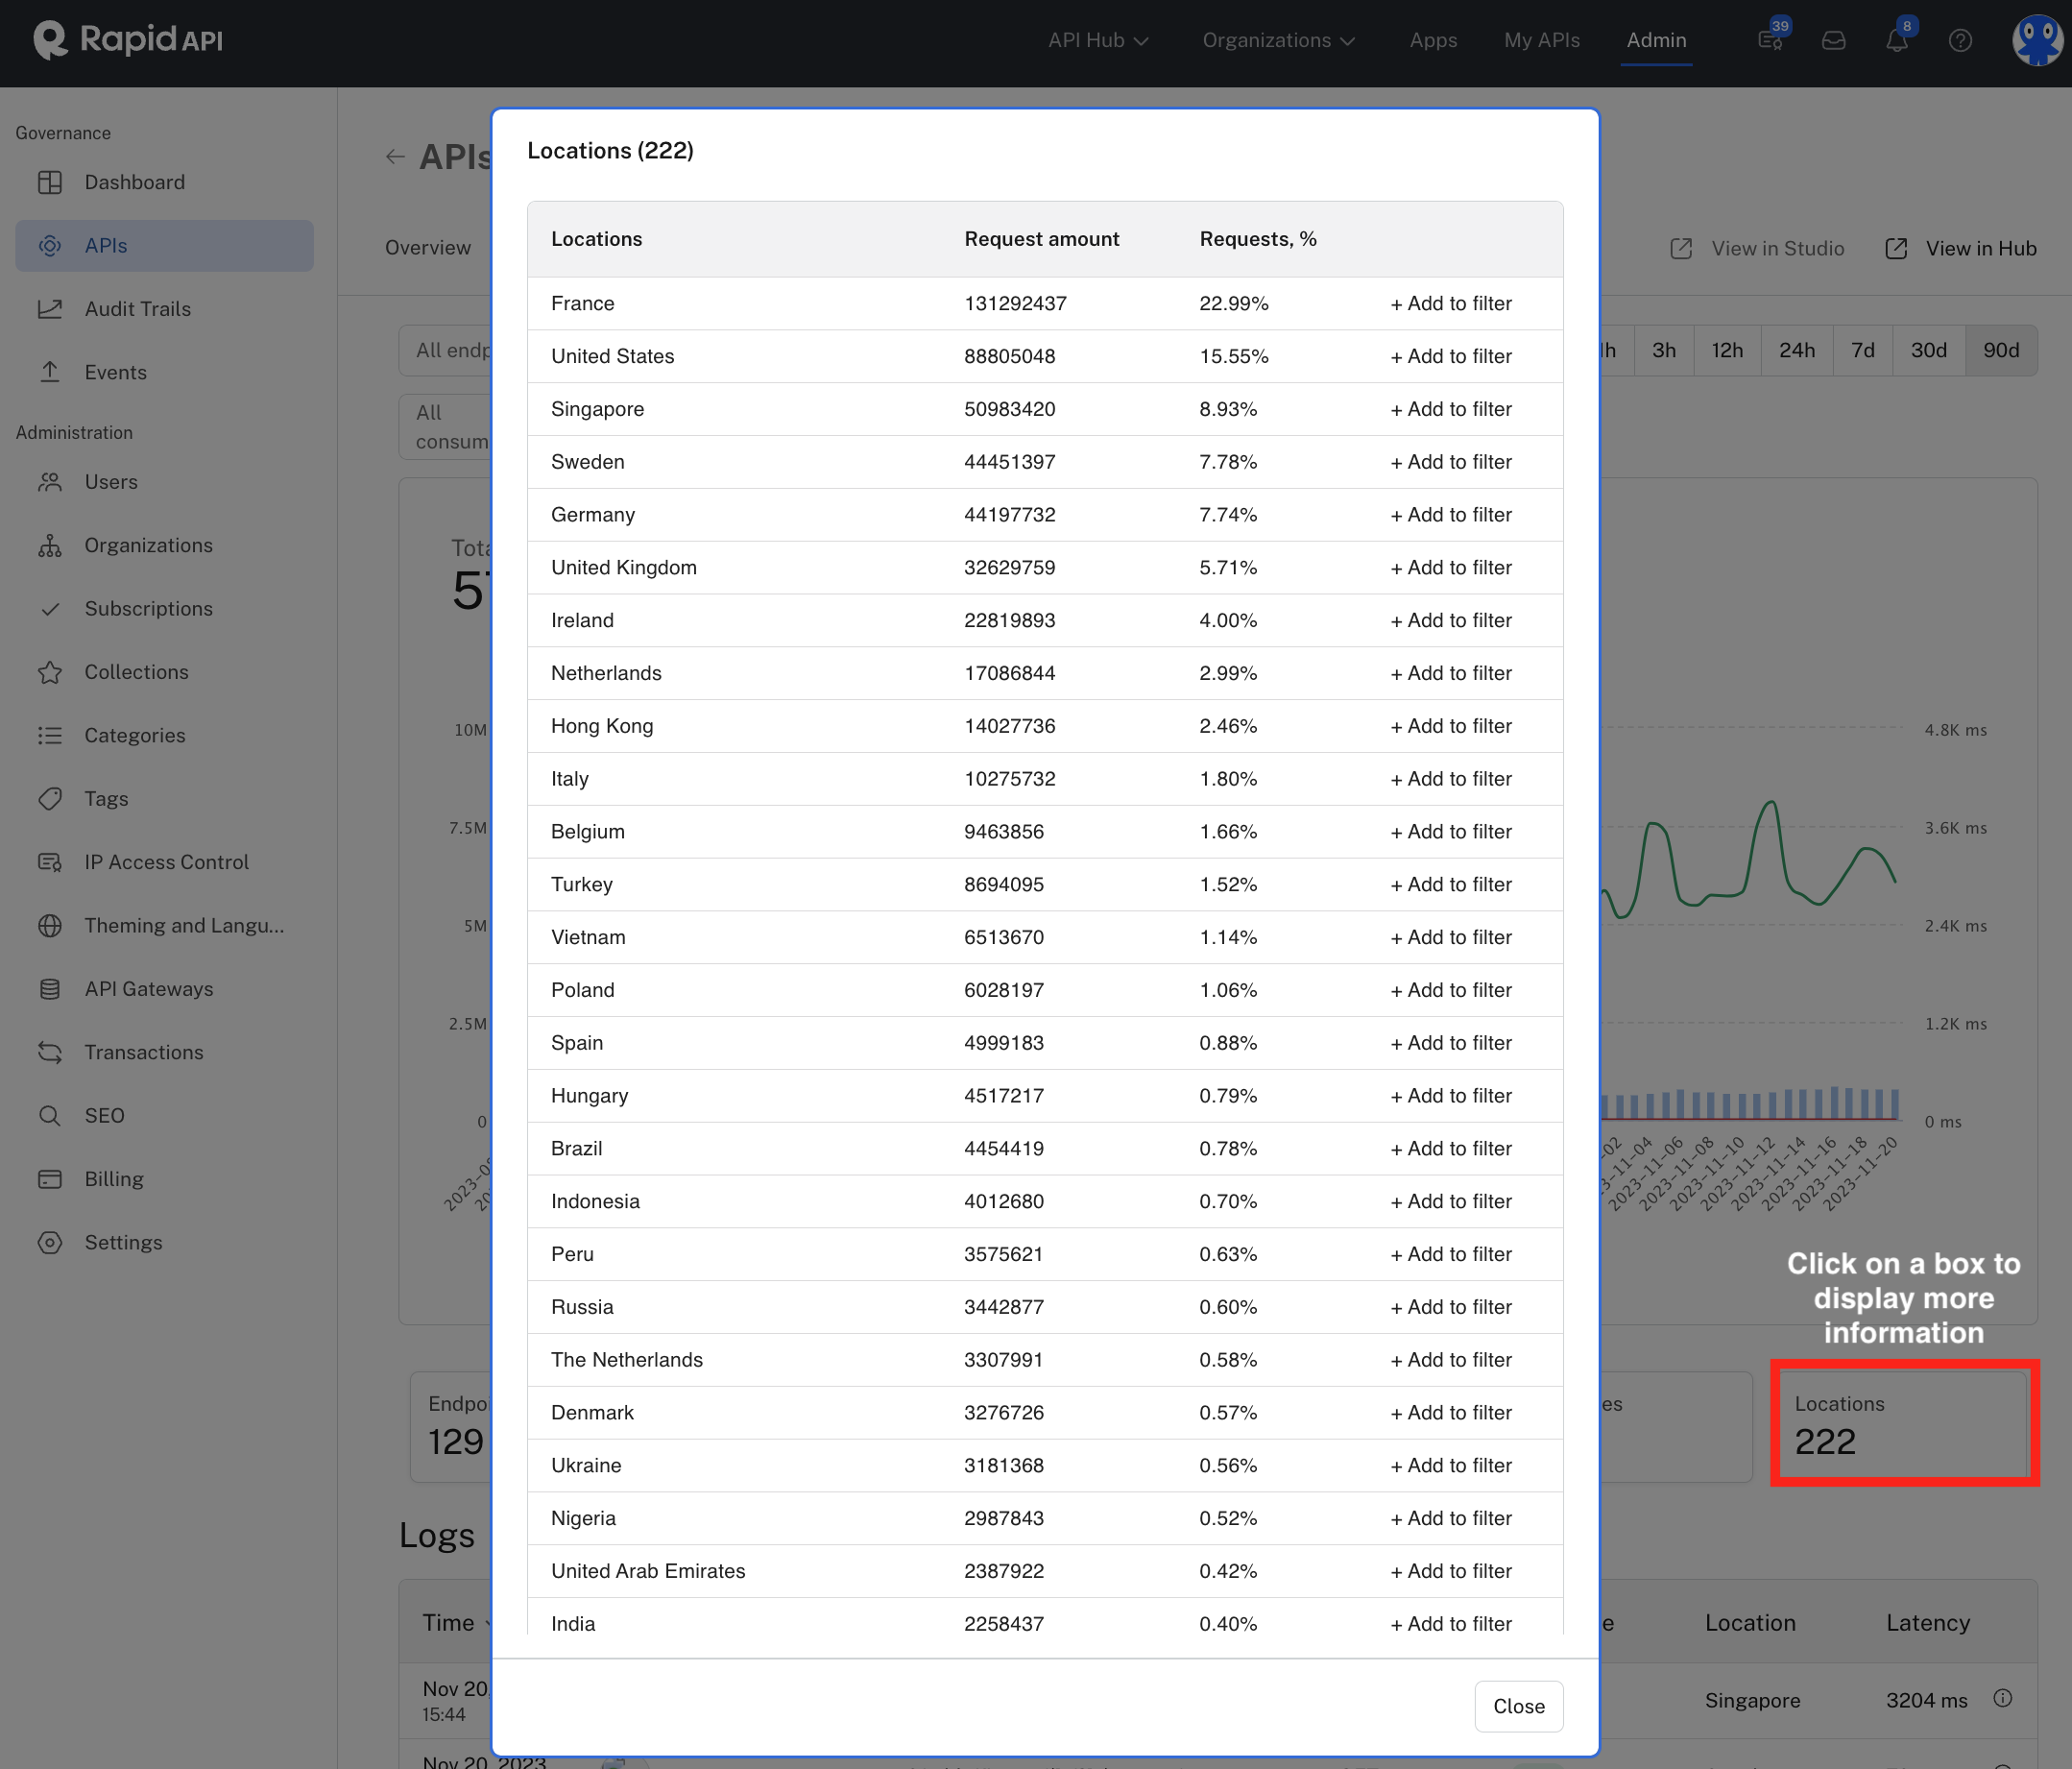
The popup that results by clicking Locations.
The third major section of the Analytics and usage tab is near the bottom of the page. This shows the usage logs for each call made by API consumers. The logs contain the following information:
- Time (and date) - click the Time heading to reverse the order of the displayed time/date
- API consumer - Click the API consumer name to be brought to the User or Team page in the Admin Panel
- HTTP endpoint
- API version
- HTTP method
- HTTP response code
- Location - the country of origin of the API consumer
- Latency
Click the info button on the right to display more details of the API call, such as request and response headers, and request and response bodies. An example log details popup is shown below.
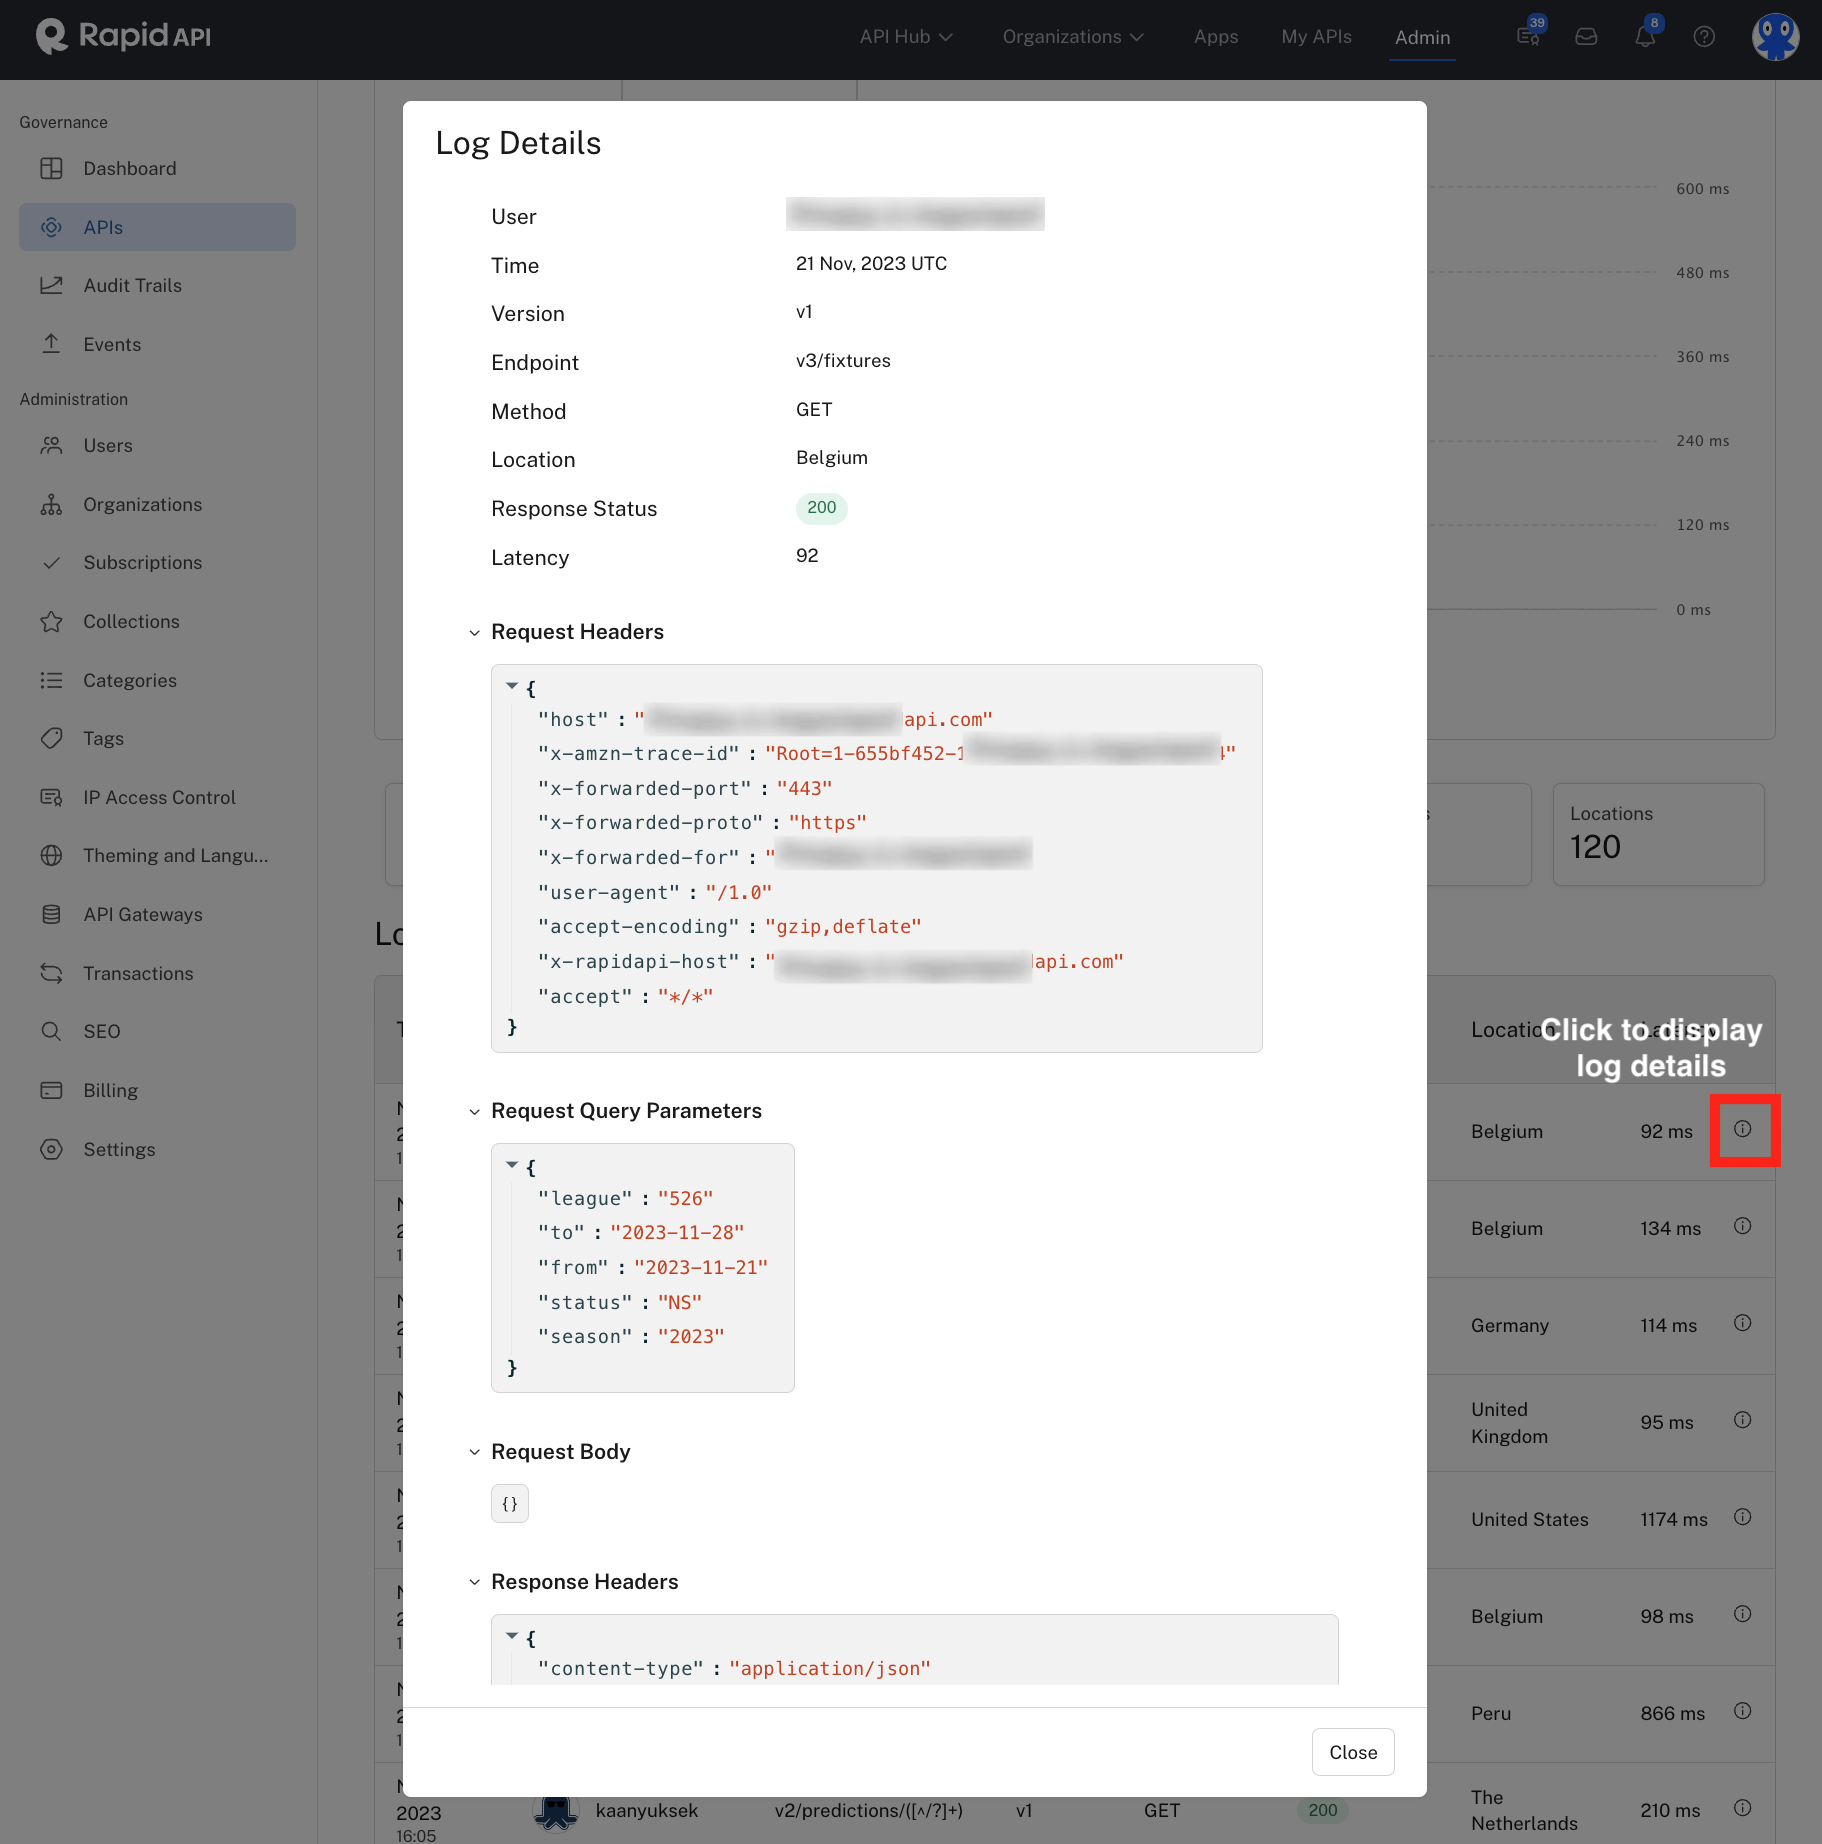
Click the info icon to view an API request's details.
API details: Transactions tab
Click the Transactions tab for an API to view its monetization information (if any). This tab is only relevant if you are utilizing the monetization functionality of the RapidAPI platform.
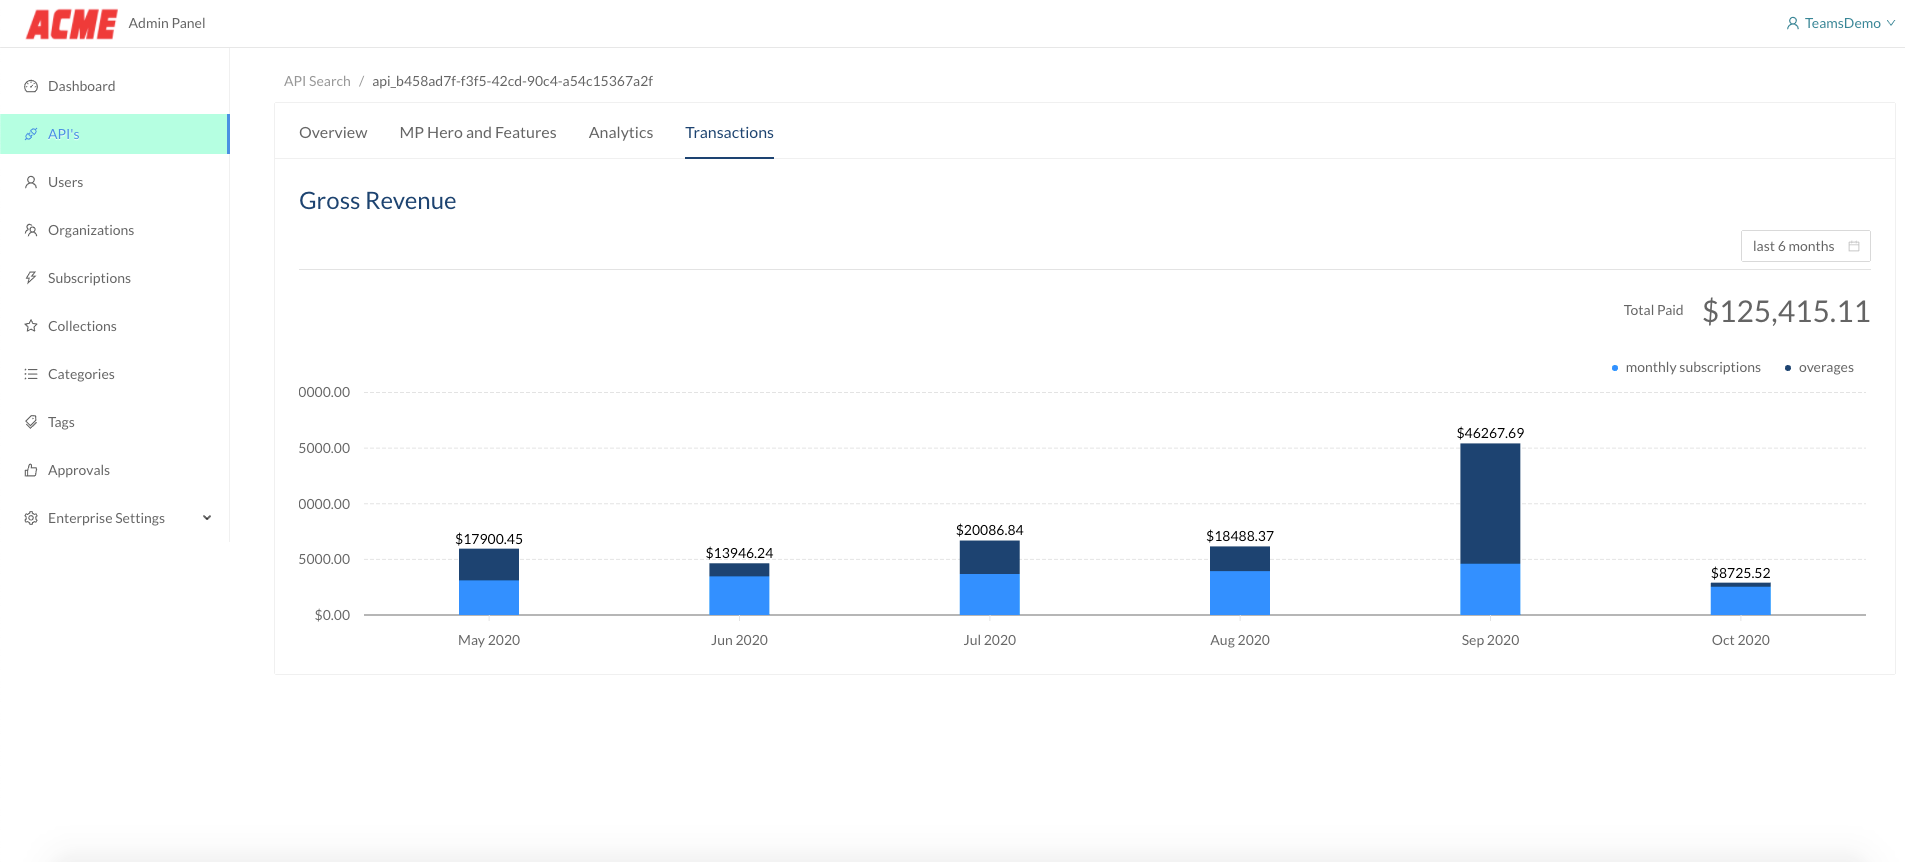
The Transactions tab when viewing an API's details.
Updated 8 months ago