Testing Performance
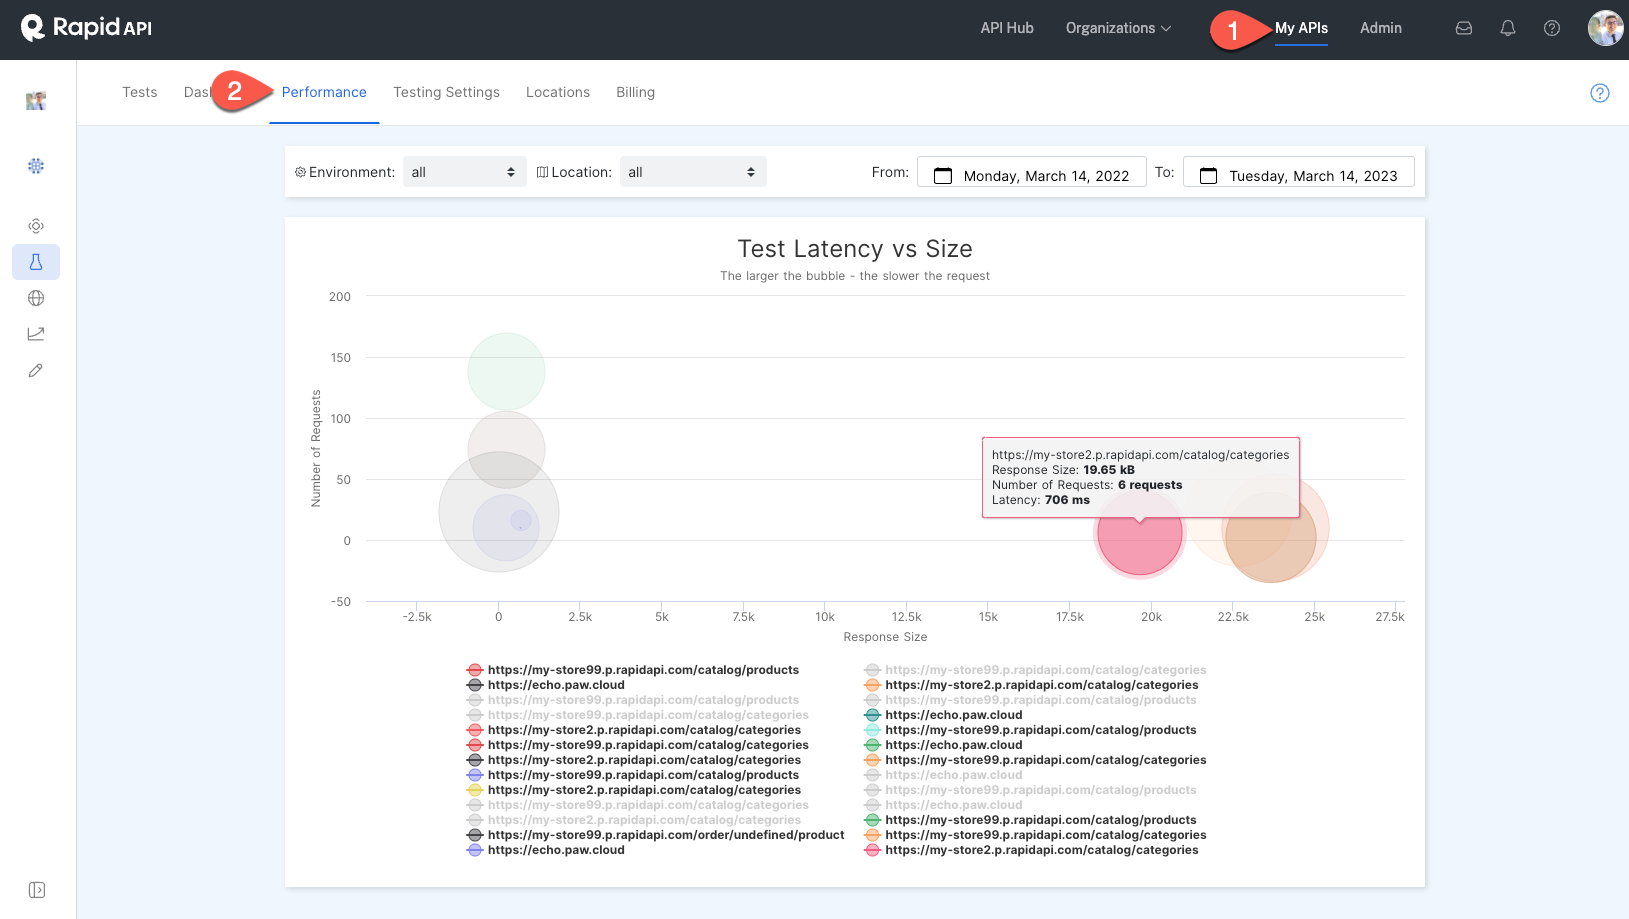
The Performance graph is used to discover large or slow requests that may be bottlenecking the responsiveness of your API. The Performance graphs the number of requests vs the response size from each request and displays the average speed of each request in your API Project as a bubble, with a larger bubble corresponding to a slower request.
Hovering over a bubble will display the request, the average response size, total number of requests, and the average latency of the request.
Clicking on a request in the graph's legend will hide that request's bubble in the Performance graph. This may cause the Performance graph to dynamically resize.
You can filter the Performance graph by adjusting the environment, location, and date range fields at the top of the page.
You can access the testing Performance graph by navigating to Studio, selecting your API Project, and clicking Performance.

Updated 11 months ago