Analytics Overview
Breakdown of the relevant personas, features, and tools used for analytics in Rapid.

It doesn't matter whether you are a single developer, small team, or enterprise building an API hub, when it comes to analytics, Rapid has got you covered. We structure our analytics into unique experiences that are tailor-made for multiple personas, as described below.
Personas
API provider analytics
You have built an API and uploaded it to the hub? Great! Once consumers start calling your API, you can use the insights provided to improve your API experience. Understand your API traffic by endpoint or consumer, monitor for errors, alert on latency spikes, and much more. Analytics for API providers is available through Studio (My APIs).
API consumer analytics
You have come to Rapid to discover and consume APIs? Great! You can view and analyze your API call history going back up to one year! You can break down traffic by App, API, endpoint, and time directly in the platform, or export the raw logs. Consumer analytics is available via the Developer Dashboard (Apps).
Admin analytics
Your enterprise might be struggling with a lack of visibility into your API traffic, or might have generic logging solutions that create too much noise and hide critical information. Rapid supports both internal and external gateways and scales with your organization, offering multi-cloud gateway integrations to get data into Rapid from wherever it lives. We empower environment admins with cross-API metrics and dashboards for the most critical API management information. Admin analytics can be found on the Admin Panel and can be obtained using the GraphQL Platform API.
Features
Real-time analytics
Regardless of your role, when it comes to APIs, there are generally three main metrics everyone cares most about: volume, error rate, and latency. The analytics near real-time widget (updated within 5 minutes), can display each of these dimensions down to a one minute resolution and offers 30 days of history. In addition to that, metrics can be analyzed using standard aggregation functions.
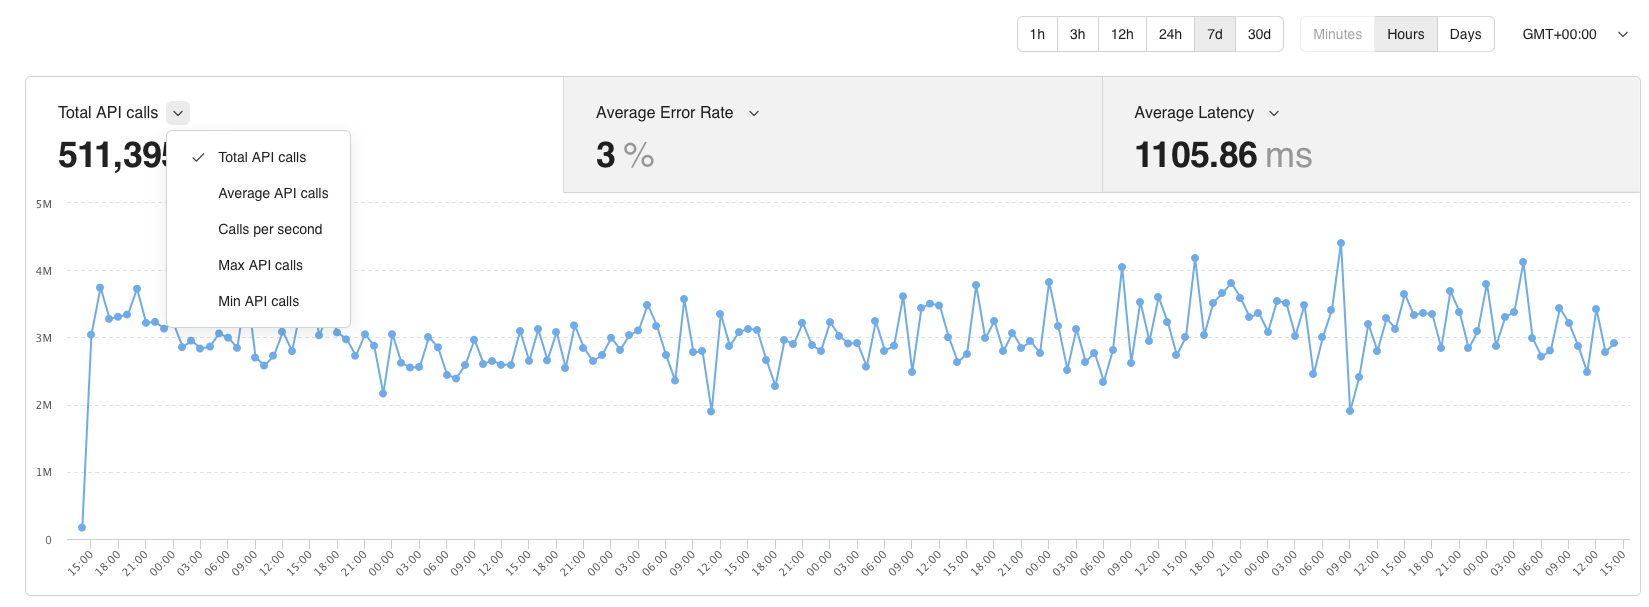
Analytics displayed in the Developer Dashboard (Apps).
Raw logs
API developers and consumers can access 7 days of historical logs with all information relevant to them. Logs include the entire content of the request, including the headers, body, and response (this can be disabled). In addition, logs can be exported and analyzed using external tools like spreadsheets. Developers can also see which consumer made each API call.
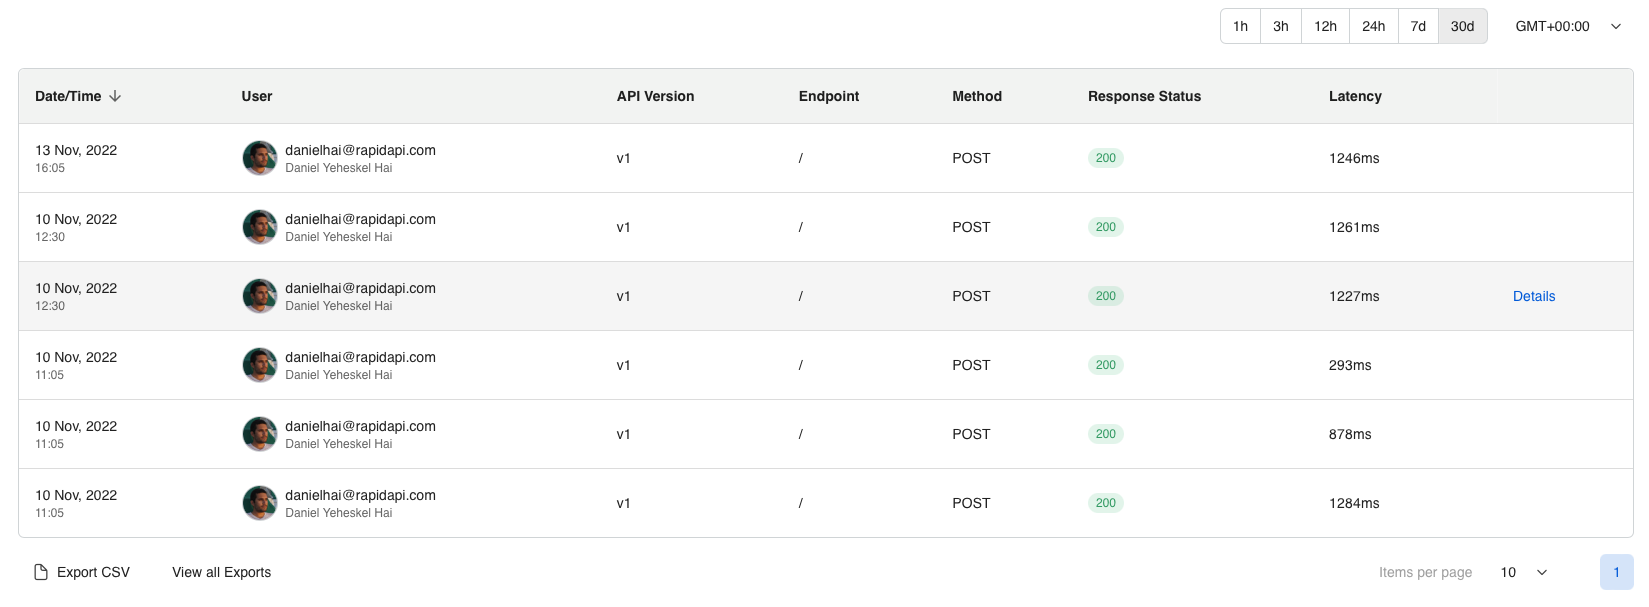
Viewing API usage logs in in Studio (My APIs).
Admin dashboards
Enterprise customers can use the analytics dashboard in the Admin Panel to gain a quick overview of key metrics and trends. The dashboard can summarize trends on a 7-day or 30-day basis, and covers categories like governance, API traffic, and billing.
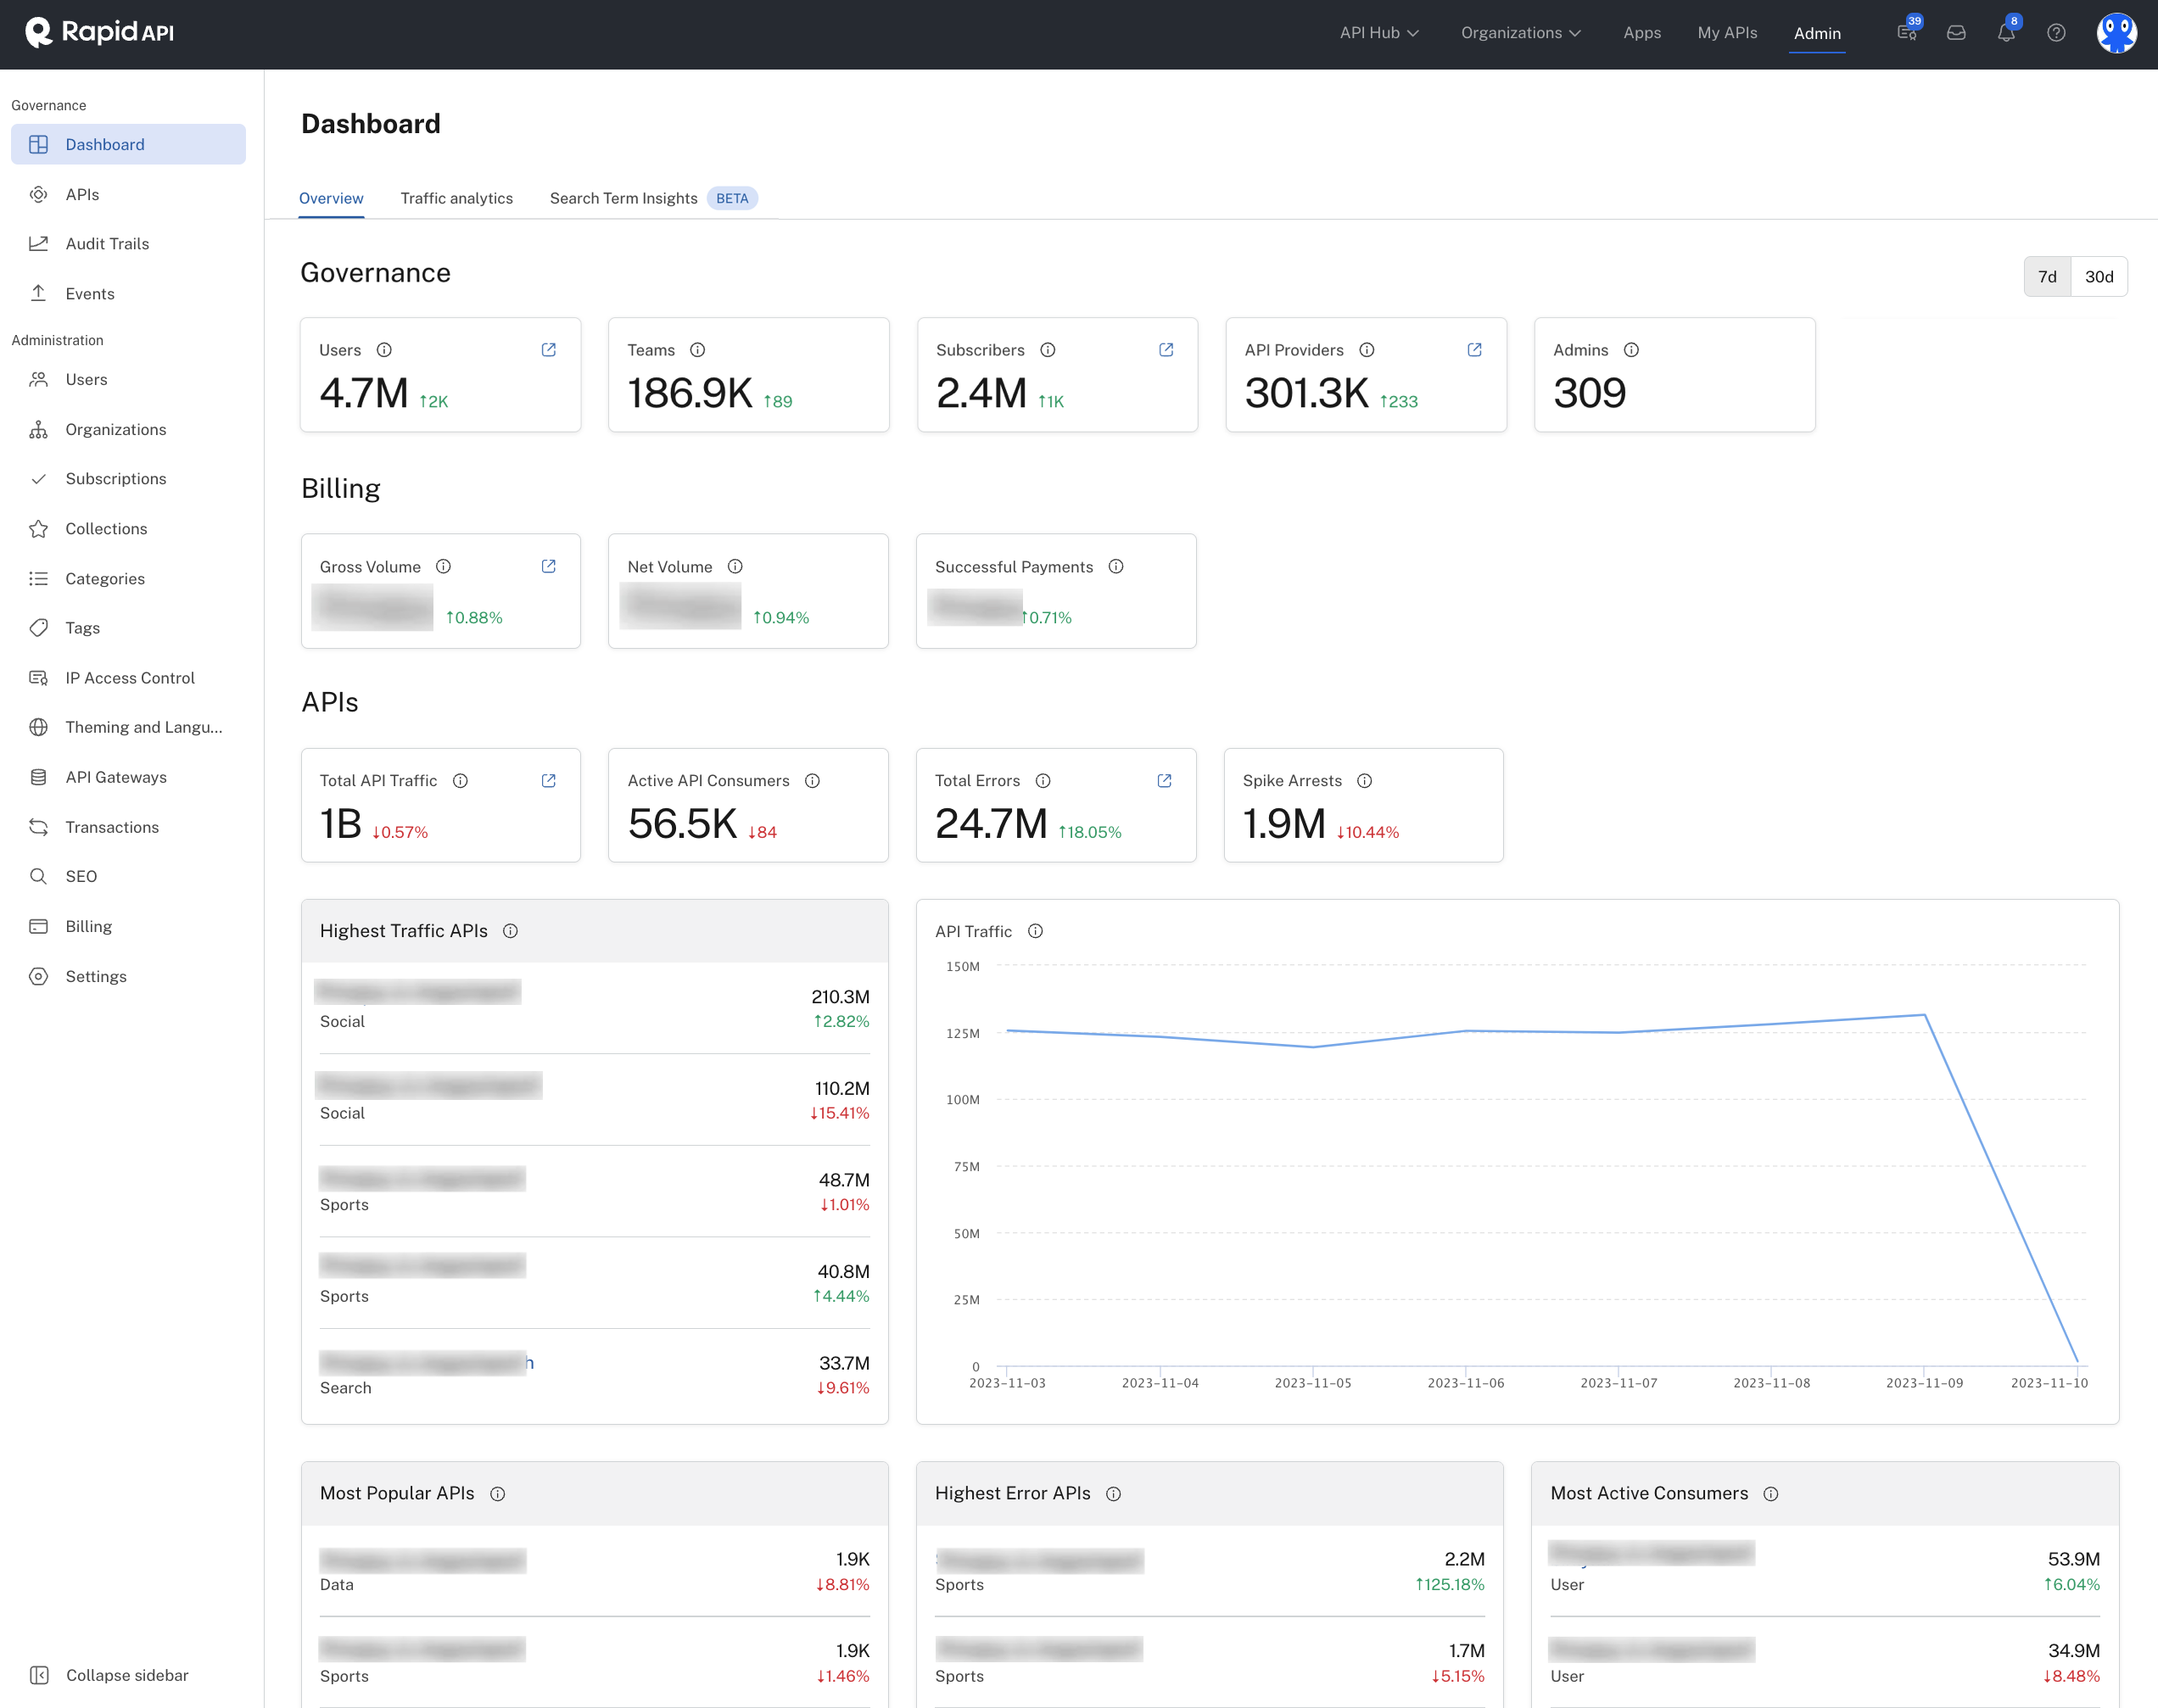
Analytics displayed in the Dashboard tab of the Admin Panel.
Revenue analytics
For monetized APIs, providers can quickly understand income broken down by fixed price and overages for up to one year of history. For more information, see Revenue Analytics.
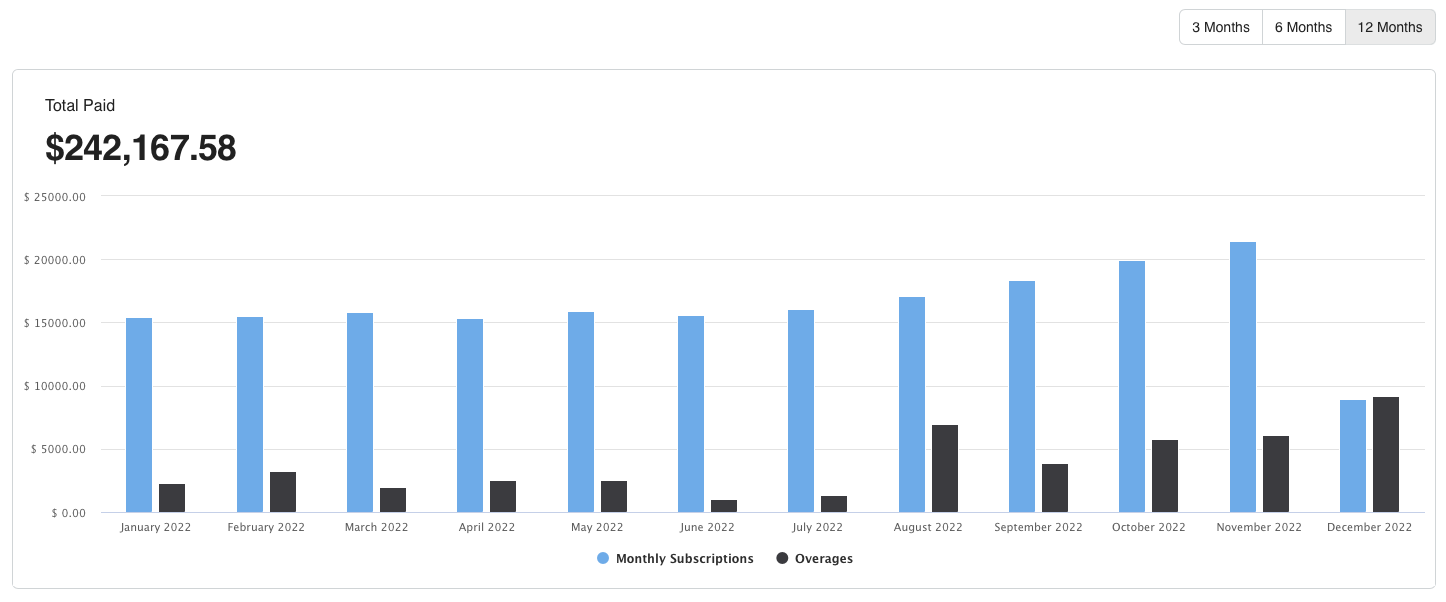
Viewing an API's revenue in the Analytics > Revenue Analytics tab of Studio.
User analytics
As a provider, gain insights into your API consumers and monitor key metrics like active users (DAU, WAU and MAU) and total users. For more information, see User Analytics
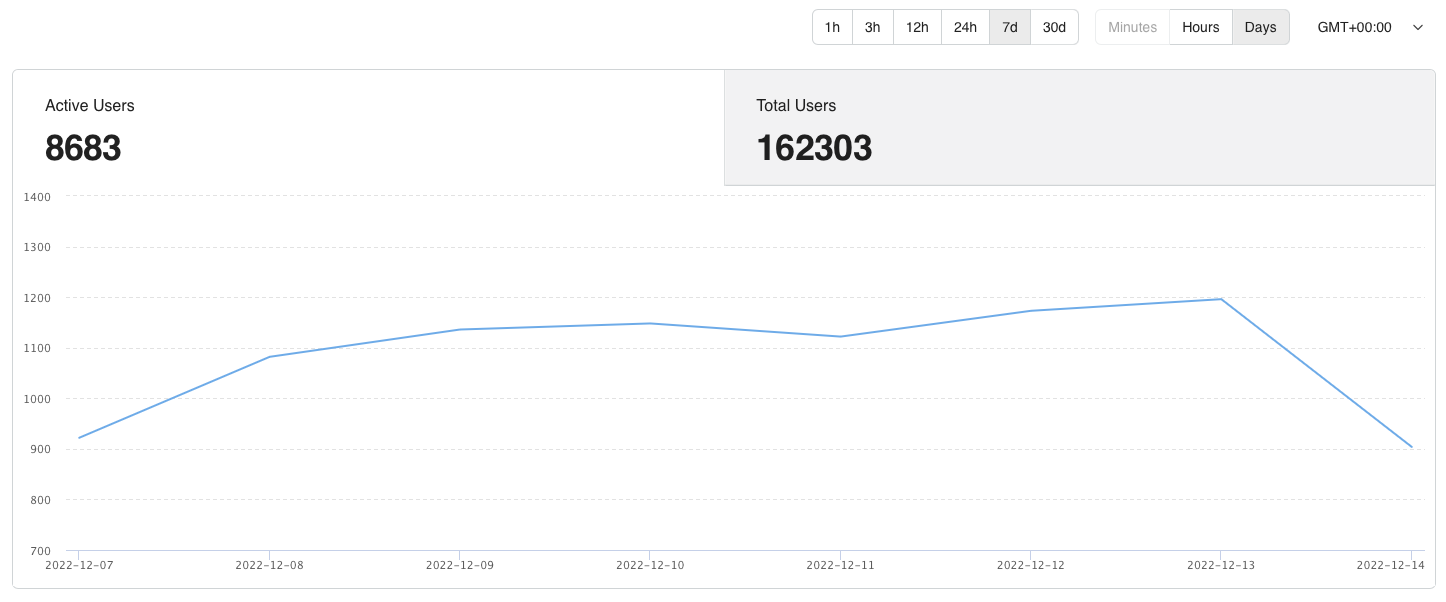
Viewing an API's user analytics in the Analytics > User Analytics tab of Studio.
Tools
Alerts
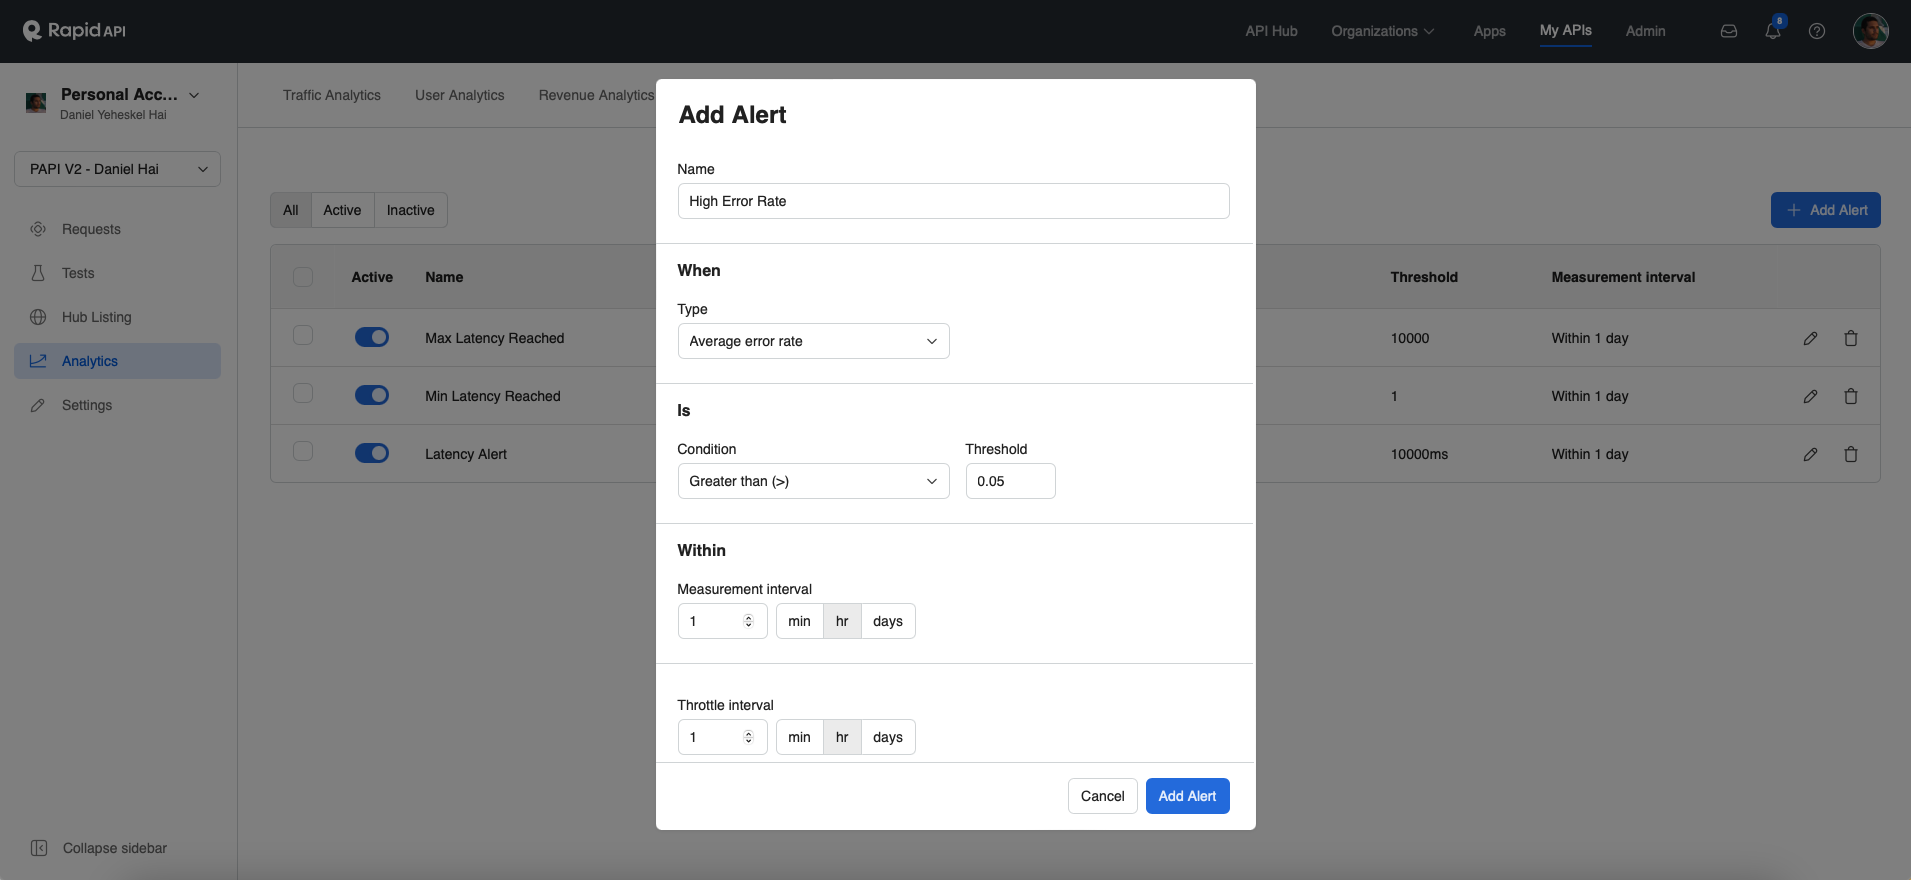
Rapid offers a no-code solution for setting thresholds on all key API metrics and creating custom alerts for when those thresholds are crossed within a specified time period.
Platform Analytics API
Customers who use external gateways or don't pass their API traffic through the Rapid Runtime can still use all analytics features by importing their logs through this API. The “/calls” endpoint supports both bulk uploads of API calls and streaming which is common for gateway or middleware integrations. See Platform Analytics API.
Gateway integrations
Using the Platform Analytics API, it is possible to import logs to Rapid from any tool or service. There are some prebuilt integrations for connecting your external gateway with Rapid. The currently supported integrations are listed on this page: Analytics Gateway Integrations.
Updated 11 months ago