
Dashboard
View comprehensive usage data for your API Hub.
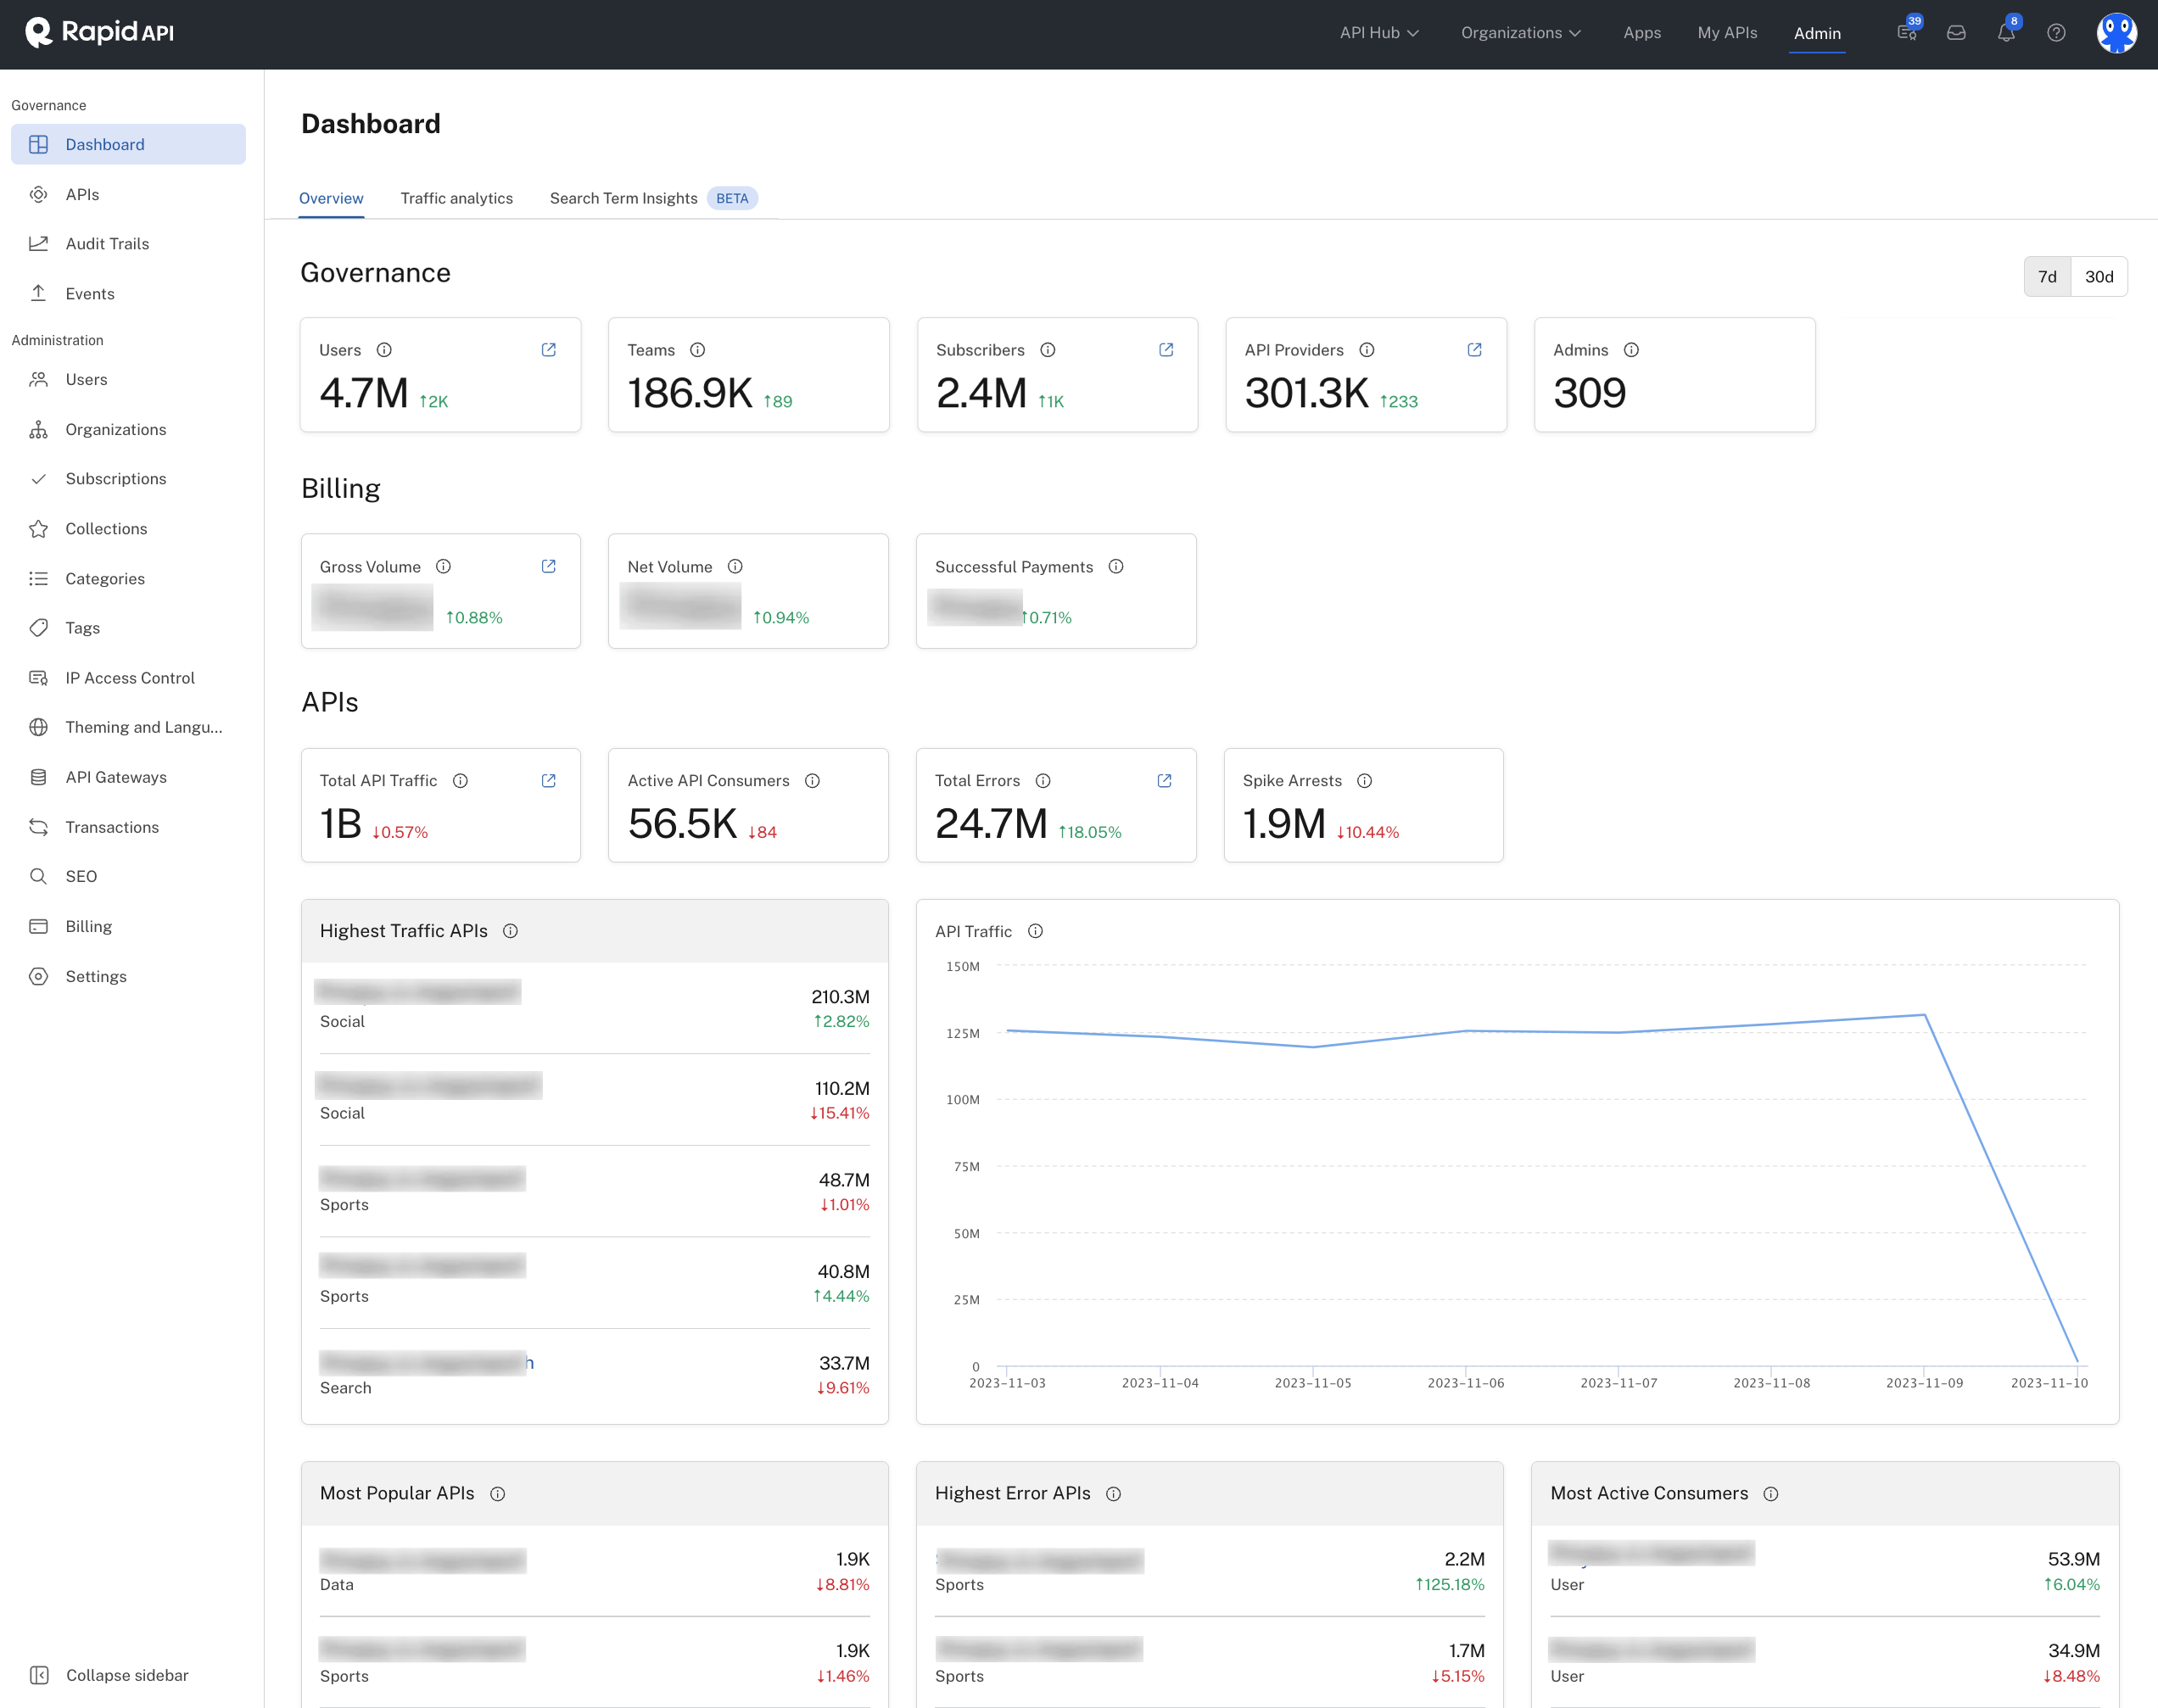
The Admin Panel's Dashboard tab provides a comprehensive view of usage in the Enterprise Hub. It is divided into three main tabs - Overview, Traffic analytics, and Search term insights..
Admin Panel's Dashboard tab.
Overview tab
The Overview tab displays four sections: Governance, Billing, APIs and Hub. Use the 7d and 30d buttons on the upper right to show metrics trends over the last 7 or 30 days.
Governance
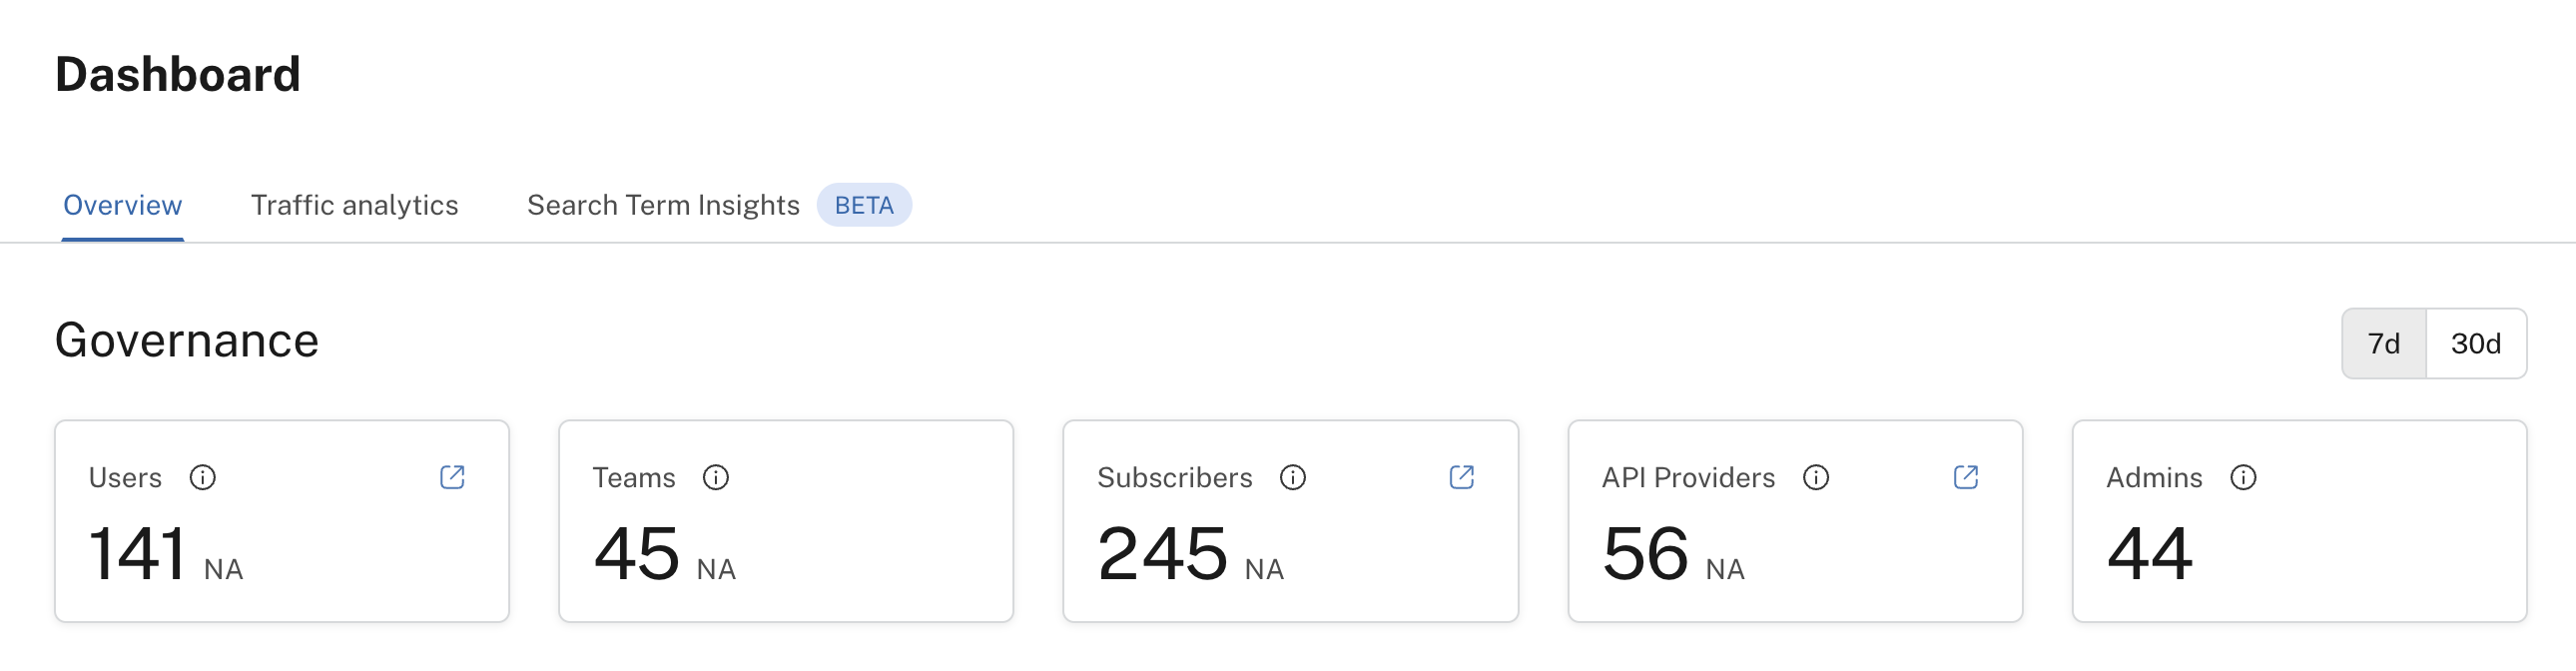
The Governance section of the Admin Panel's Dashboard tab.
This section includes:
- Users: The total number of users in the Enterprise Hub. The small number to the right indicates the number of new users within the selected period (or NA if there is no change). Click on the icon in the upper right to navigate to the Users tab of the Admin Panel.
- Teams: The total number of teams in the Enterprise Hub. The small number to the right indicates the number of new teams within the selected period.
- Subscribers: The total number of team and user subscriptions to all APIs in Enterprise Hub. Click on the icon in the upper right to navigate to the Subscriptions tab of the Admin Panel.
- API Providers: The total number of teams and users that have added at least one API to the Hub. Click on the icon in the upper right to navigate to the Subscriptions tab of the Admin Panel, which shows details that includes a "Provider" column for API subscriptions.
- Admins: The total number of Environment Admins in the Hub. These are users who have access to the Admin Panel.
Billing
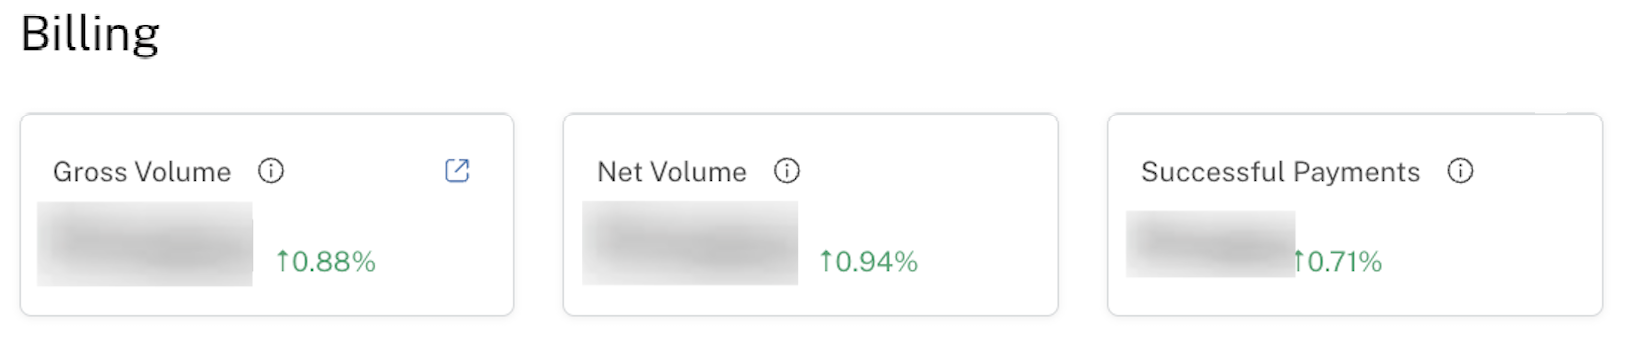
The Billing section of the Admin Panel's Dashboard tab.
This section only applies if you are monetizing APIs using Stripe on your Hub. It includes:
-
Gross Volume: The estimated monetary amount (in US dollars) of all successful payments made by API consumers, including payments that are refunded or disputed. Click on the link in the upper right to navigate to the Admin Panel's Transactions tab.
-
Net Volume: The estimated monetary amount (in US dollars) of payments made by API consumers minus refunds and disputes. This number does not include Stripe's fees.
-
Successful Payments: The total number of successful payments made by API consumers. This number includes payments that are refunded or disputed.
APIs
This section includes:
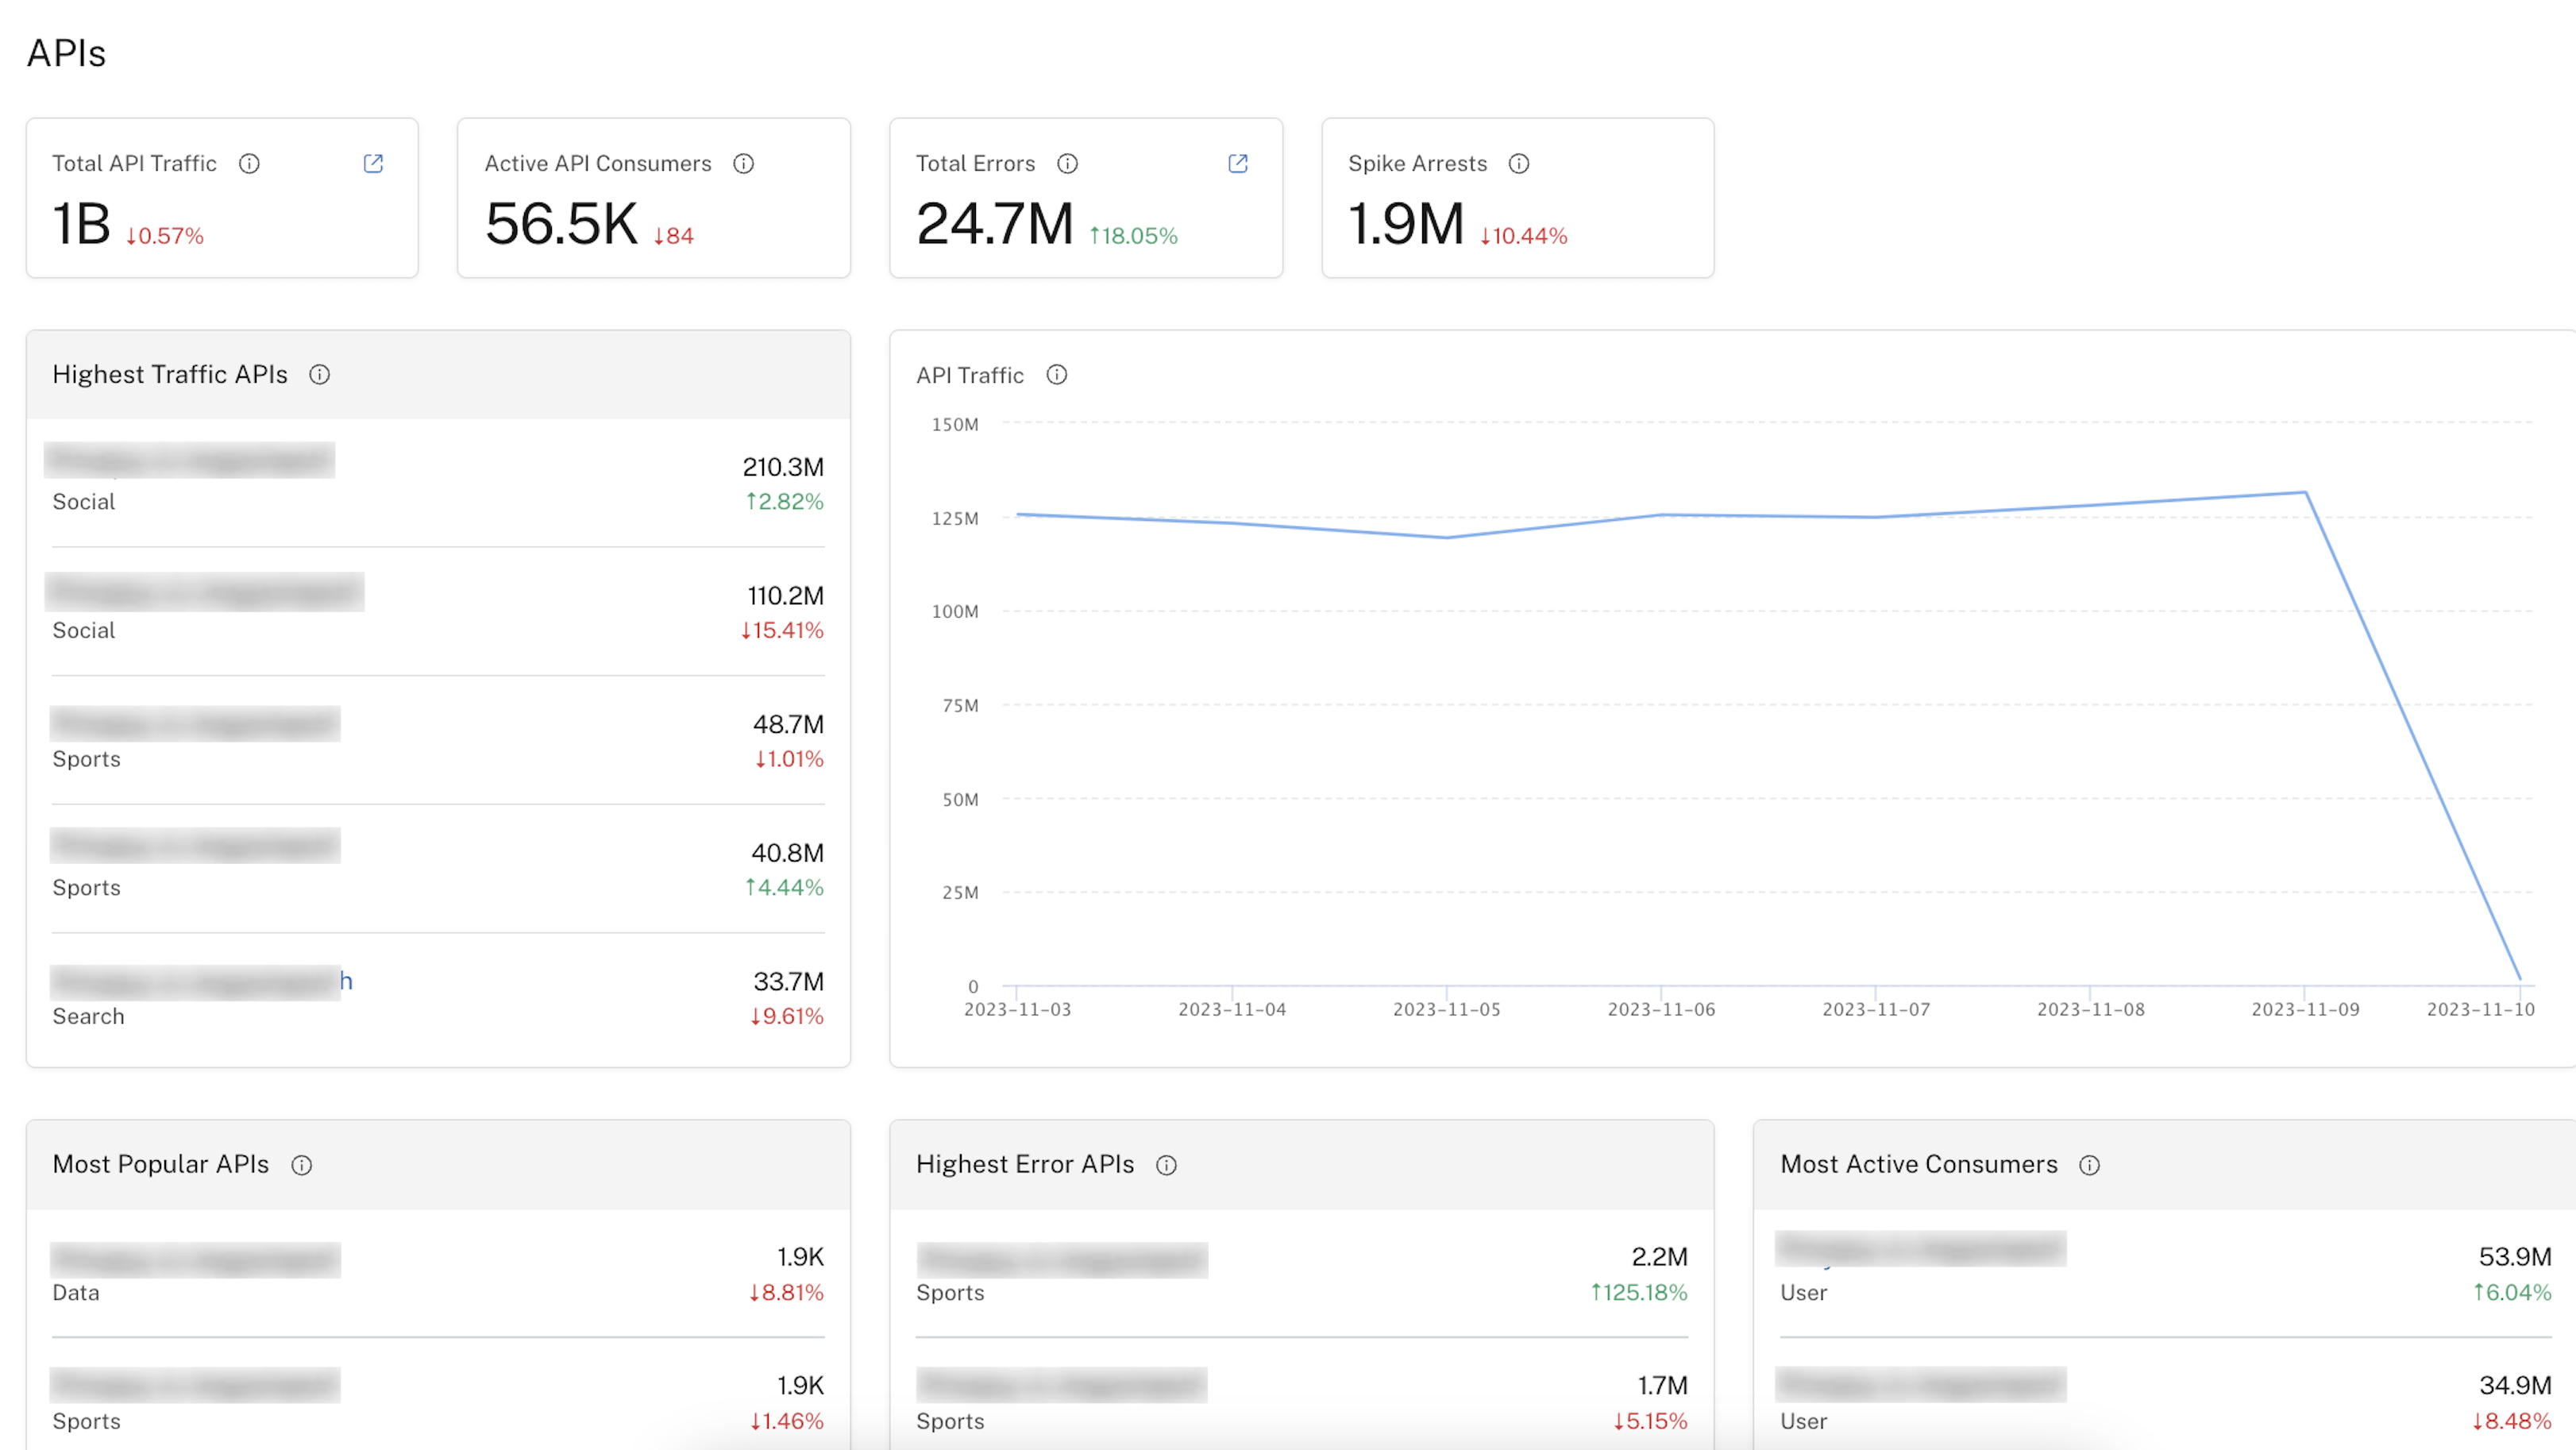
The APIs section of the Admin Panel's Dashboard tab.
-
Total API Traffic: The total count of all API calls made by API consumers. This includes calls made through the Rapid Runtime, or calls imported using the Platform Analytics API. This helps monitor the trends of API traffic and identify potential threats, such as spikes that could indicate misuse or attacks, or drops that could indicate technical issues. Click on the link in the upper right to go to the Admin Panel's APIs tab.
-
Active API Consumers: The number of teams or users who made at least one API call within the selected period. This can provide insights into the level of engagement of an API and help inform decisions related to capacity planning, resource allocation, and product development.
-
Total Errors: The count of API requests that returned an error code within the selected period. This helps detect potential issues or risks. To see more information about the errors, click on the link in the upper right to navigate to the Traffic analytics tab. This allows you to to see a more detailed breakdown of when the errors happened. For details related to a specific API, use the Analytics and usage tab for the API.
-
Spike Arrests: The count of all API calls that responded with the error code 429 (Too Many Requests). This is important in monitoring spikes in API traffic and detecting potential security threats. To see more information about the errors, click on the Traffic analytics tab.
-
Highest Traffic APIs: The five APIs with the highest amount of API calls made during the selected period. This can help organizations identify potential traffic spikes and proactively address them to ensure their APIs remain available and responsive. To view more analytics for a specific API, click the API's name to be brought to the API's Analytics and usage tab for the API. The label under the API name indicates the API's Category. The top number on the right indicates the total number of call made to the API for the selected period. The number under that indicates the percentage of increase or decrease in API calls compared to the previous period.
-
API Traffic: This is the chart displaying the total number of daily API calls for the selected period. Monitoring API traffic on a daily line chart can provide valuable insights into the usage patterns of your APIs. By tracking daily traffic, organizations can identify trends and make informed decisions about capacity planning and resource allocation. If you are looking for a lower time resolution (hours/minutes), navigate to the Traffic analytics tab.
-
Most Popular APIs: The five APIs with the highest number of teams or users that made at least one call to the API during the selected period. To view more analytics for a specific API, click the API's name to be brought to the API's Analytics and usage tab for the API. The label under the API name indicates the API's Category. The top number on the right indicates the total number of unique users or teams that made calls to the API for the selected period. The number under that indicates the percentage of increase or decrease in unique users or teams compared to the previous period.
-
Highest Error APIs: The five APIs with the highest error rate. This can be used to pinpoint areas for improvement. To view more analytics for a specific API, click the API's name to be brought to the API's Analytics and usage tab for the API. The label under the API name indicates the API's Category. The top number on the right indicates the total number of calls made to the API over the selected period that resulted in an error response. The number under that indicates the percentage of increase or decrease in calls that resulted in errors compared to the previous period.
-
Most Active Consumers: The five users or teams making the highest number of API calls across all apps owned by the user or team. This can reveal partnership opportunities and provide customer insights. Click the user or team name to view more information about the user or team. Clicking on a user name navigates you to the user in the Users tab of the Admin Panel. Clicking on a team name navigates you to the Organizations tab of the Admin Panel. The organization that contains the team is displayed. Click the Teams tab to view details about the team.
The top number on the right in the Most Active Consumers section indicates the total number of call made by the team or user for the selected period. The number under that indicates the percentage of increase or decrease in API calls compared to the previous period.
Hub
The Hub section of the Admin Panel's Dashboard tab.
This section includes:
- Public APIs: The total number of public APIs on the Enterprise Hub. Public APIs are discoverable by any use logged into the Enterprise Hub.
- Private APIs: The total number of private APIs on the Enterprise Hub. Private APIs are discoverable only by the user or team that owns the API, or by entities (users, teams, organizations) that have been invited to consume the API.
Traffic analytics tab
The Traffic analytics tab of the Dashboard contains a near-real-time chart (up to a five min delay) that can be used to analyze your overall API traffic load, error rate, and latency. Based on the time periods you want to show, different resolutions can be used.
For each of those dimensions, you can replace the aggregation function to show the average, median, max, min, or total. Do this by opening the dropdown near the dimension for which you would like to change the aggregation function.

Traffic analytics tab of the Admin Panel's dashboard
In addition, you can change the line chart to display any of the dimensions by clicking that tab.

Viewing the Average Error Rate in the Admin Panel's dashboard
On the top left of the chart, you will find the API filter, which can be used to scope your search to a specific set of APIs.
Search term insights tab
Beta featureSearch term insights is a beta feature. This means that the functionality may not currently be complete. Also, this functionality is currently not supported in the Platform API.
The search term insights feature is marked as “beta” to signify its release with partial functionality. We have opted for a beta version to gather valuable customer feedback, ensuring validation of the problem/solution fit. Please note that, as part of this beta release, certain functionalities are restricted.
How often is search term insights data updated?Generally, you can expect a delay of up to 20 minutes in processing search term insights analytics. However, occasional delays in our ingestion pipeline may extend this timeframe up to a few hours.
Why am I seeing “You have reached your rate limit for the Beta version, please wait and try again”?The beta version has a low rate limit, and users may periodically encounter this error message. This limitation is intentional and in place to manage usage during the beta testing phase. Please wait until the rate limit resets to access the service again.
The Search term insights tab of the Admin Panel's Dashboard tab is used to gain actionable insights into your API Hub by viewing information about the recent searches for APIs that were made by API consumers.
This information can be used to make data-driven decisions to help maximize the quality of your API Hub, increase user engagement, increase user satisfaction, and increase API adoption. For example, it can be used to:
- Discover new API opportunities by identifying which API(s) are desired by API consumers, but may not be currently on the API Hub
- Boost existing API visibility by identifying keywords that can be added to an existing API's description, tags, or other text-based content in order for a similar API search in the future to result in a search hit for API consumers
- Track Hub usage trends by identifying trends in searches that indicate improvements or setbacks of your API Hub usage
These searches can be made from the search box at the top the API Hub page. For example, here an API consumer has searched for APIs with the word conversion.
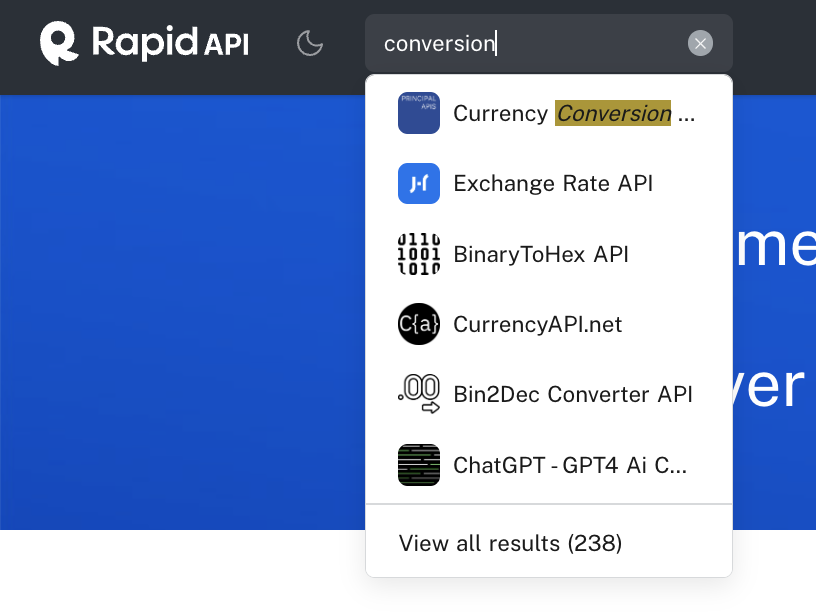
An example search from the API Hub.
The searches can also be made from the /search page of the Hub (see screenshot below), which can be accessed by executing a search as described above, then customizing the search. The search page below shows all APIs that the logged in user has access to, and was displayed simply by executing an empty search from the search bar at the top of the API Hub. It can also be displayed by clearing the existing search and clicking Enter.
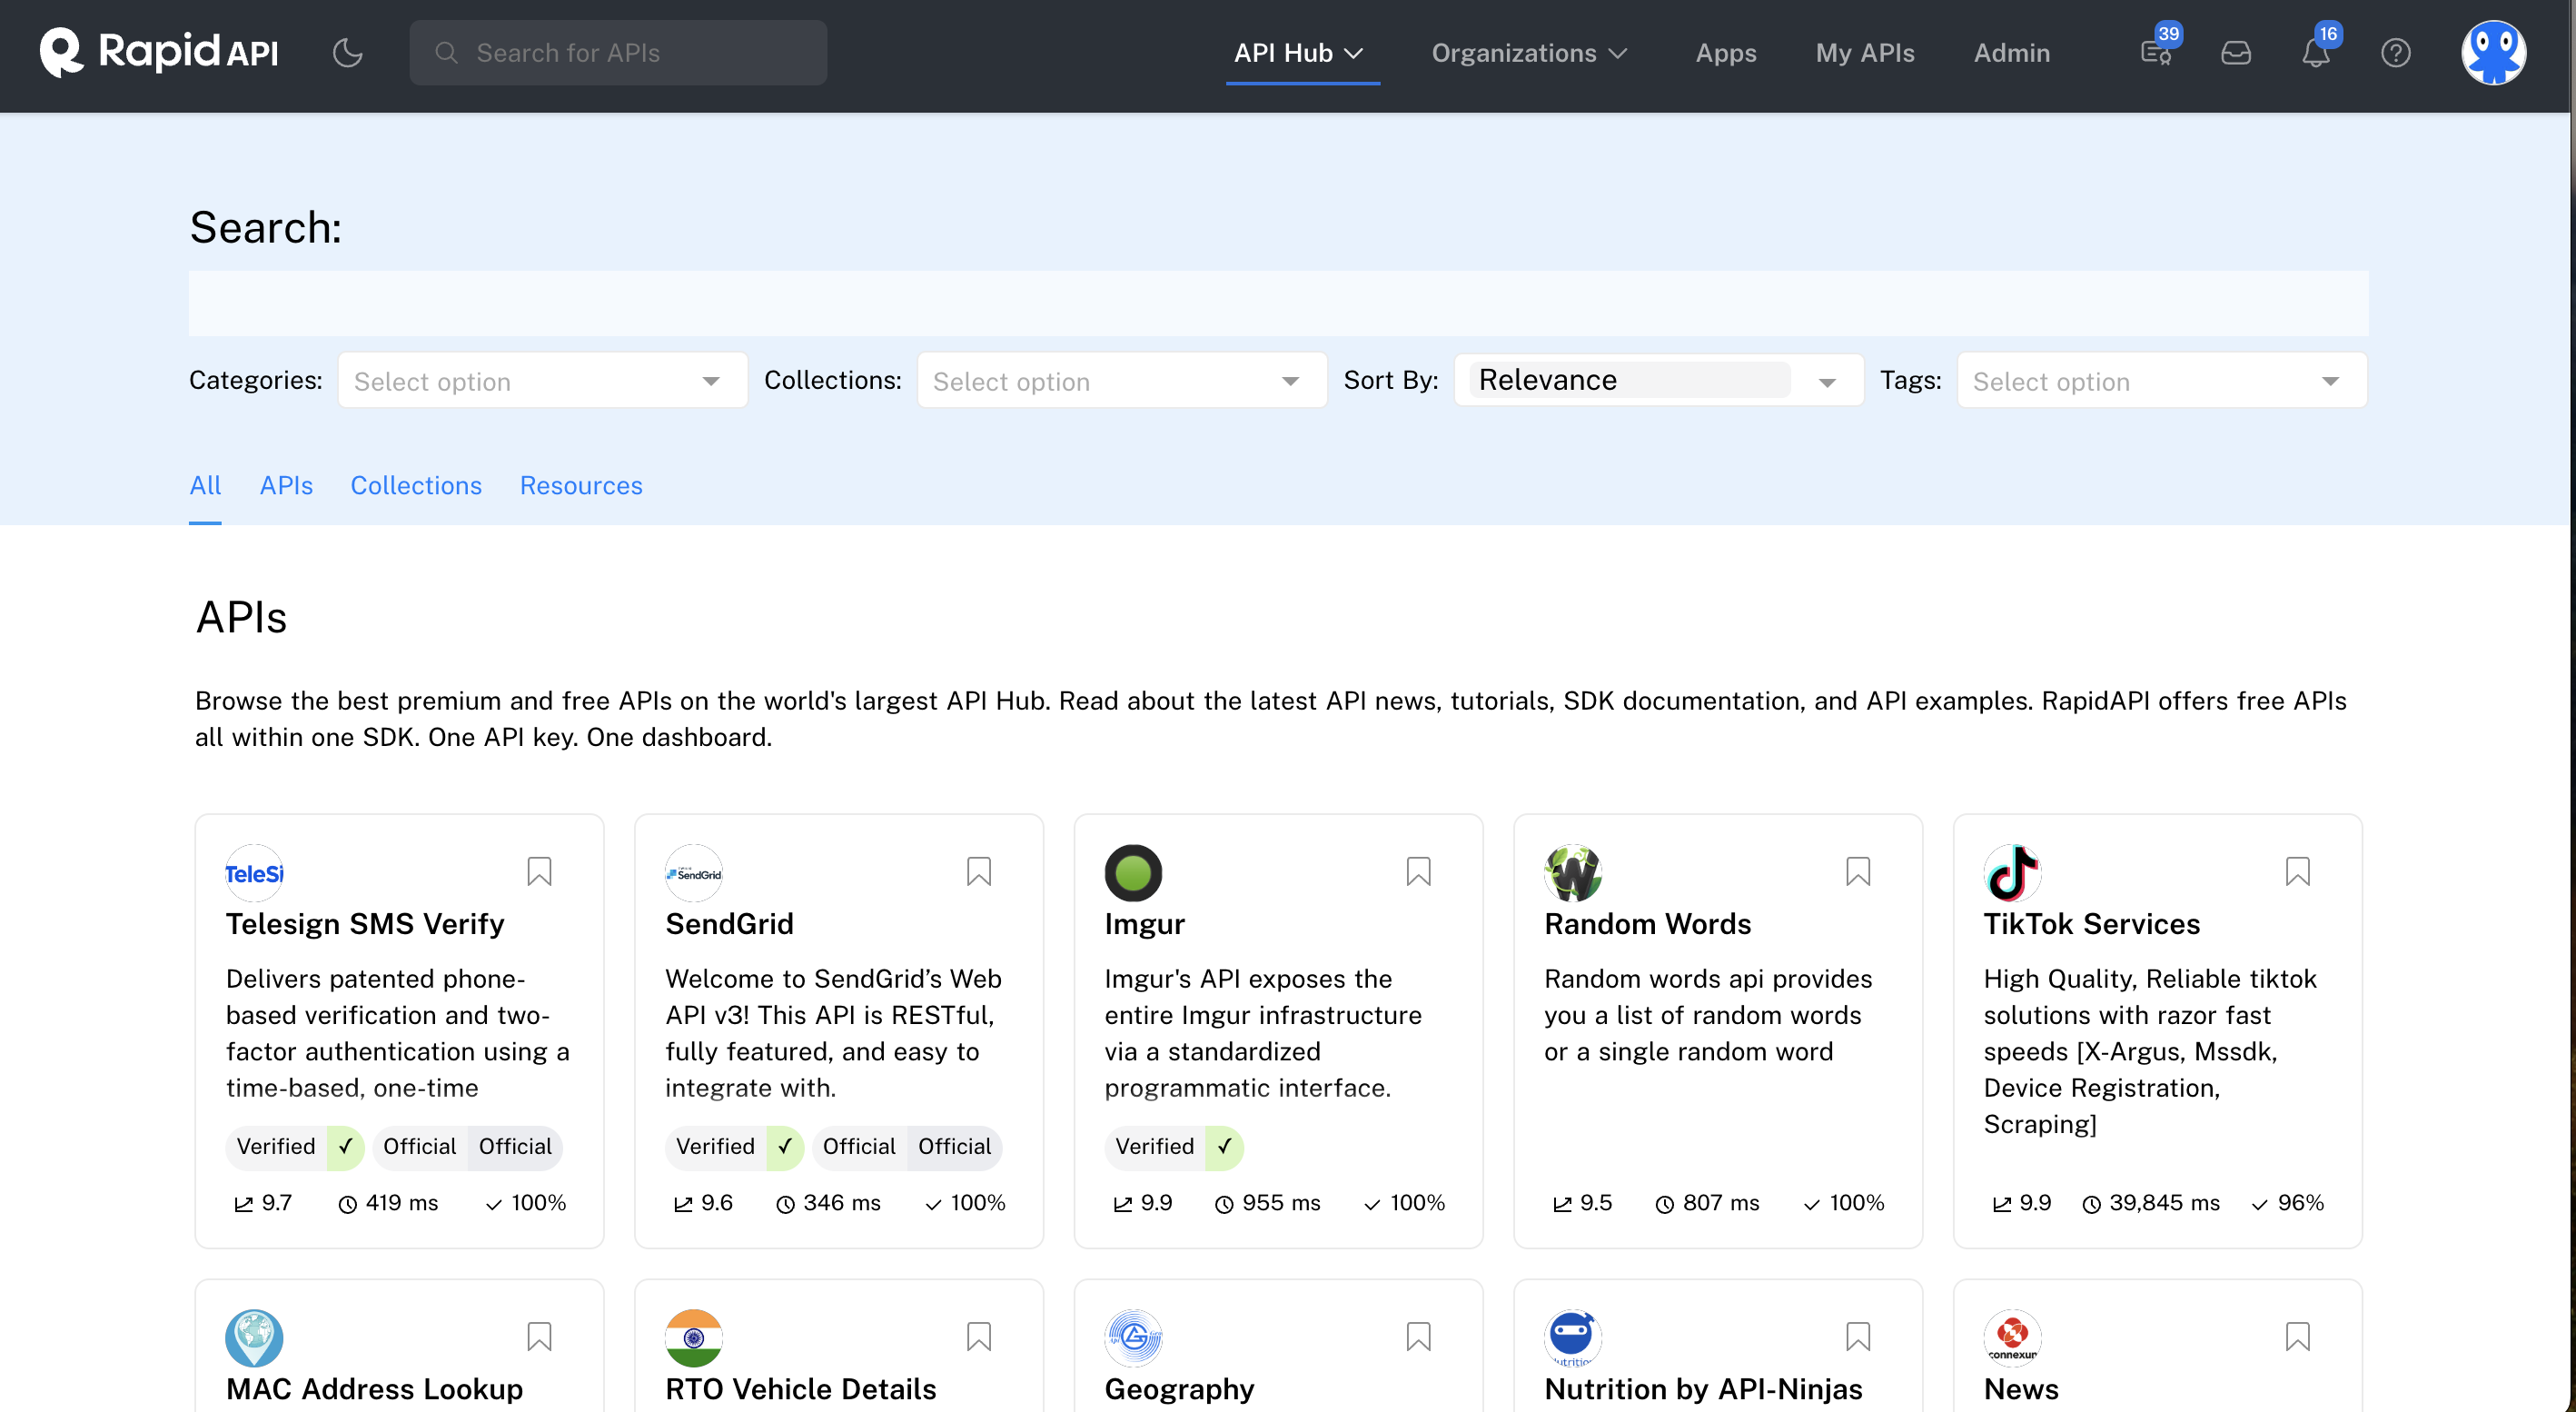
The Search page displayed after simply clicking Enter in the API Hub search bar.
The following screenshot displays the search term insights in the Dashboard tab of the Admin Panel.
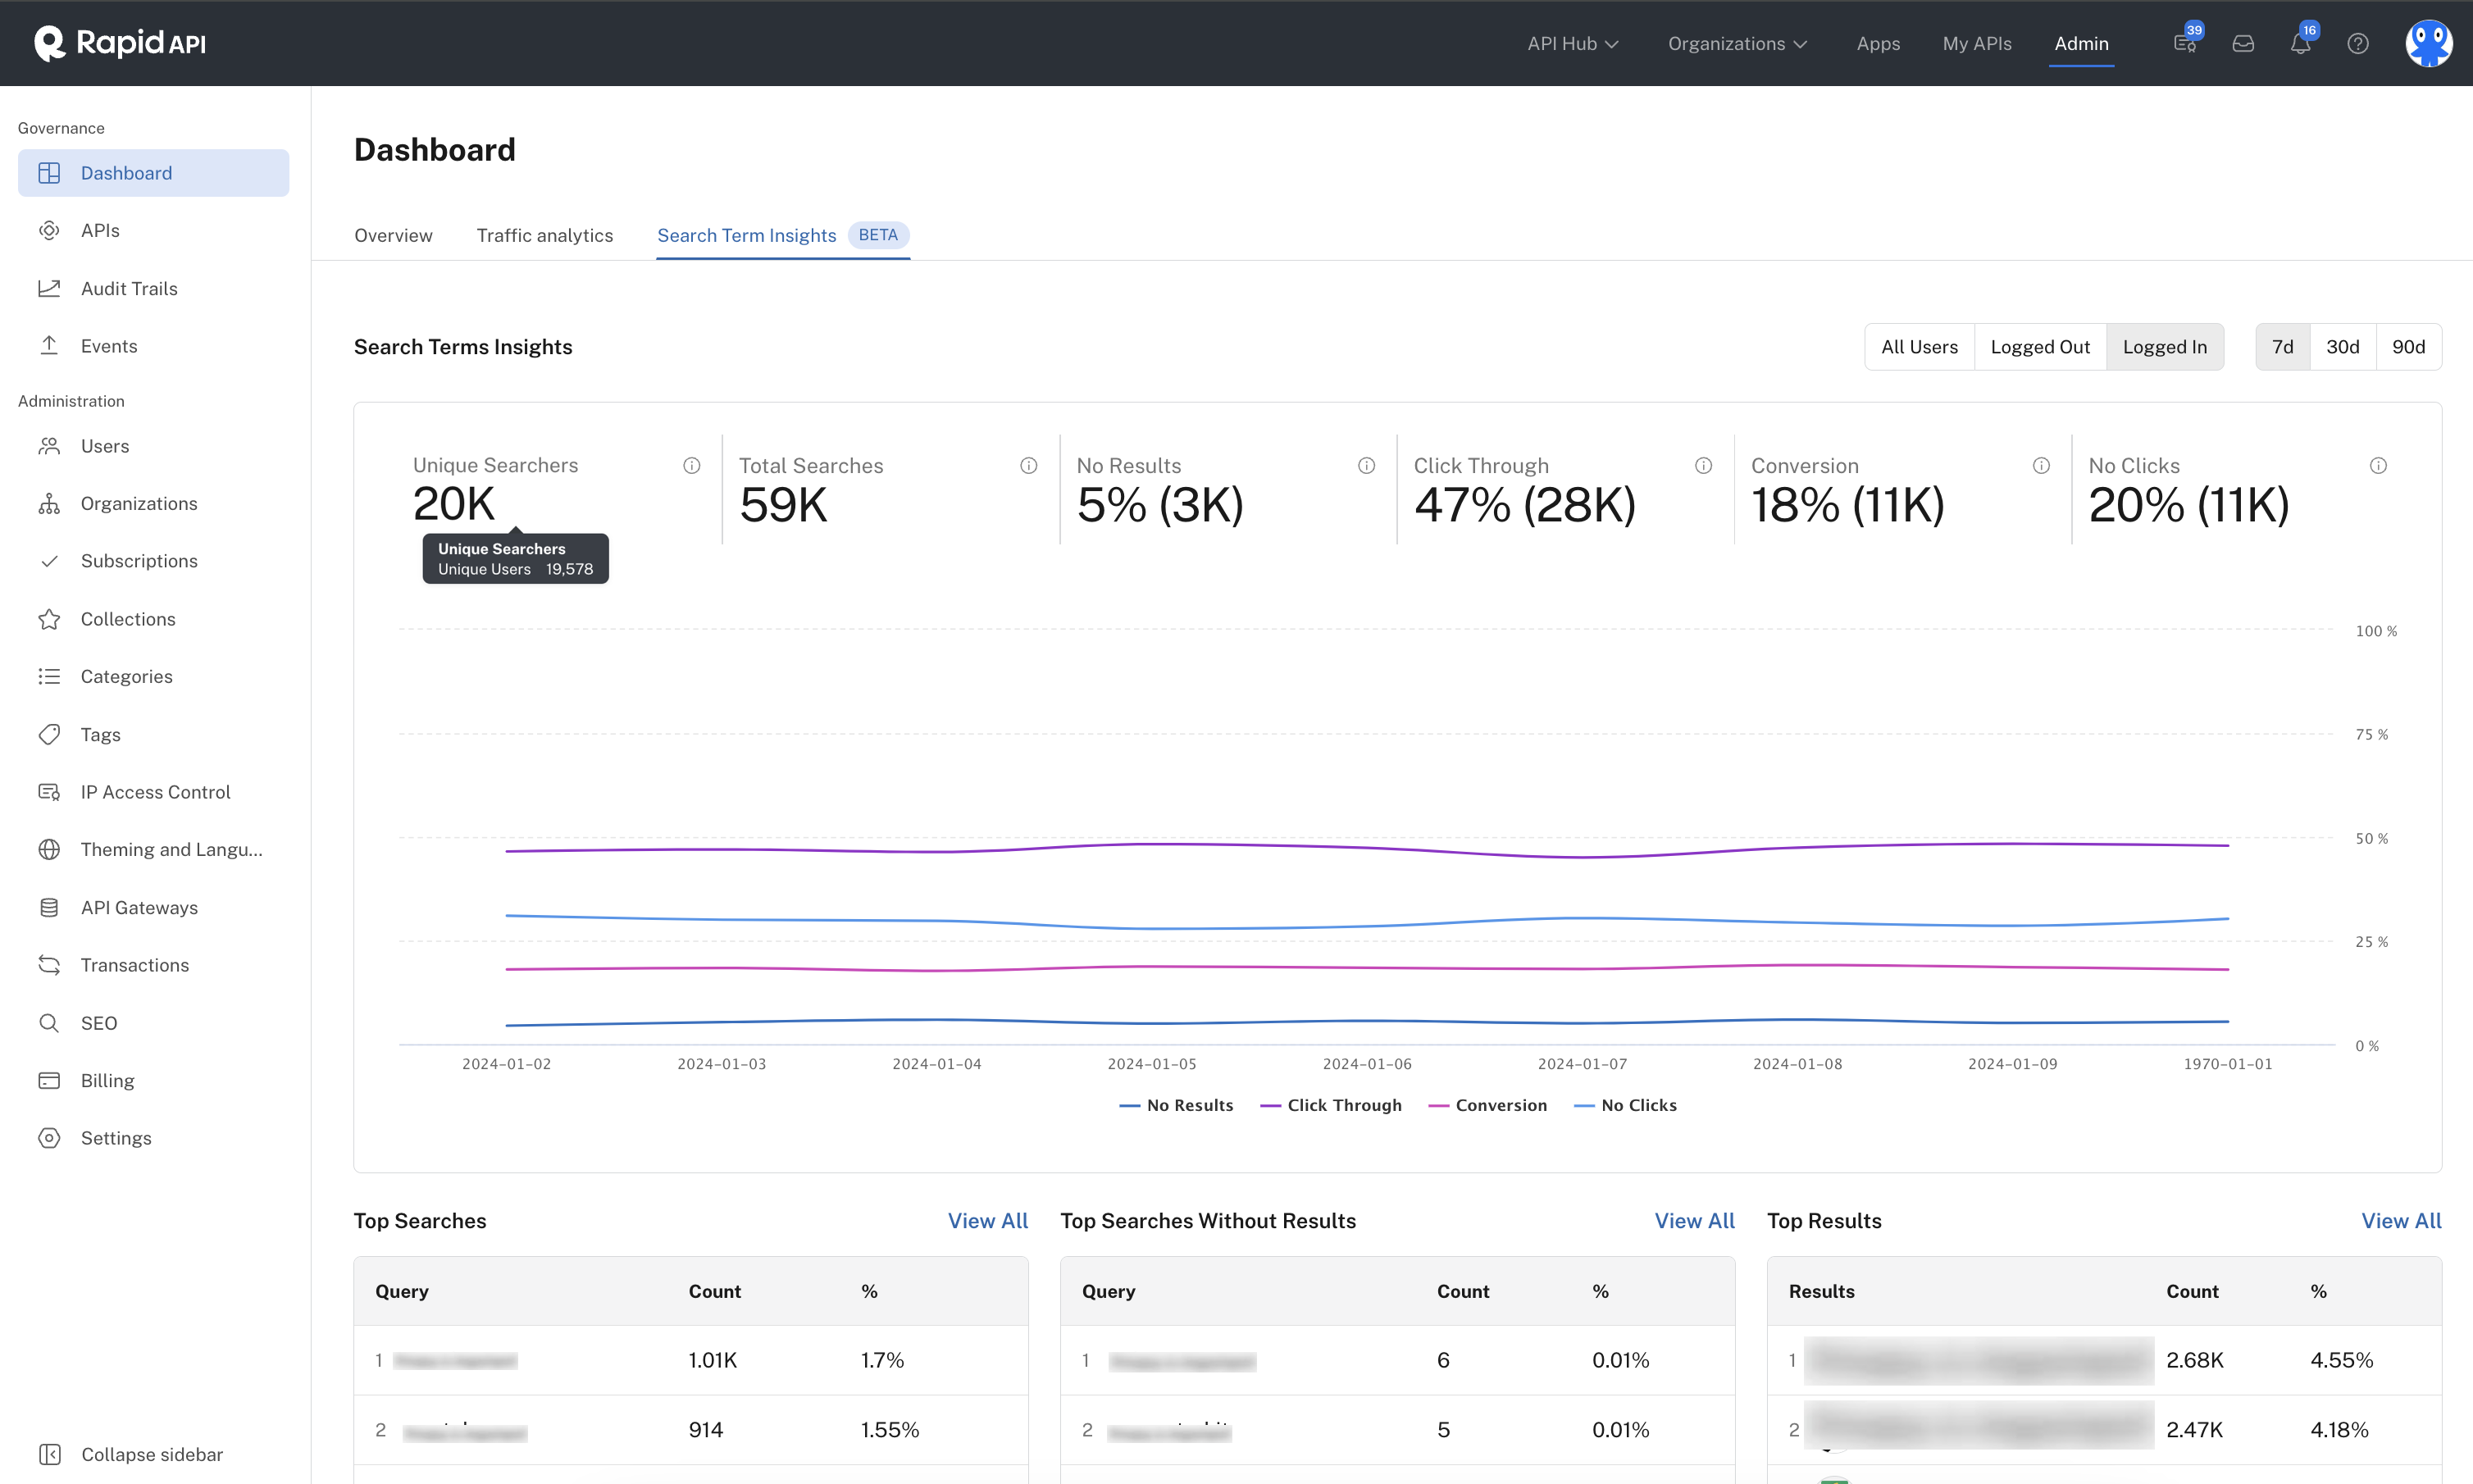
The Search term insights tab of the Admin Panel's Dashboard tab.
This page includes the following features and capabilities:
- Timespan - Click the 7d, 30d, or 90d button in the upper right to display the results for 7 days, 30 days, or 90 days, plus the results for the current date (in near real-time). The screenshot above displays 7 days of results plus results for the current date.
- User Type - Click the All Users button in the top right to display search results for all users, whether the search was executed when a user was logged into the Hub or not. Click the Logged Out button to display only results for users that have not logged into the Hub. Click the Logged In button to display only results for users that are logged into the Hub when executing the search. In the screenshot above, results are displayed for all users. This functionality allows you to determine if logged out and logged in users are engaging differently with your Hub.
- Unique Searchers - This box near the top of the page displays a key performance indicator (KPI) that shows the number of unique users that made API searches during the selected timespan. For logged out users, this number is approximate because it can be difficult to uniquely identify logged out users. Hover over the number to view a popup with the exact number of users.
- Total Searches - The total number of searches made by API consumers in the selected timespan. Hover over the number to see the exact number, and to see the average number of searches made per user.
Why am I seeing smaller numbers than expected?
As we are exclusively tracking searches performed using search terms, the observed numbers may seem smaller than expected. Searches via collections and categories are not tracked as per the current scope of the Beta version.
- No Results - Displays the percentage of total searches that did not return any API results to the searcher. The number in parenthesis identifies the number of searches that resulted in no results. Hover over this number to see specific numbers in percentage and number of searches.
- Click Through - Displays the percentage of total searches that resulted in the API consumer clicking on at least one of the APIs in the search results to further explore the API. The number in parenthesis identifies the number of searches that resulted in click throughs. Hover over this box to see specific numbers in percentage and number of searches. Click through is based on the total number of searches, including searches that returned no APIs in the results.
- Conversion - Displays the percentage of total searches that resulted in the API consumer not only clicking on one of the APIs in the search results, but testing and/or subscribing to the API. The number in parenthesis identifies the number of searches that resulted in conversions. Hover over this box to see specific numbers in percentage and number of searches. Because only logged in users can subscribe to APIs, conversion only applies to logged in users. If the user clicks on an API that they already have subscribed to, it is not counted as a conversion.
How is conversion tracked?
Conversion is currently tracked when a user subscribes to an API. Tracking occurs only through specific front-end events, such as testing an API endpoint with a free plan or successfully subscribing to a paid or freemium plan of an API.
- No Clicks - Displays the percentage of total searches in which the user did not click on any APIs in the search results. The number in parenthesis identifies the number of searches that did not result in the API consumer clicking on any API in the results. Hover over this box to see specific numbers in percentage and number of searches. The no click rate is based on searches returning at least one API result.
Why don't click-through rate (CTR) and no-click rate add up to 100%?
Click-through rate (CTR) is based on the total number of tracked searches, including those with no results. No-click rate is based on searches with at least one result. Since they are computed based on different groups of searches, they are not directly comparable, resulting in the combined percentage not necessarily totaling 100%.
- The graph below the key performance indicators shows the search term insights over time for the selected timespan. Hover over any line to see a popup of specifics for that day. The popup includes values for No Results, Click Through, Conversion, and No Clicks.
- Below the graph is the Top Searches box. This identifies the top five search words or phrases (queries) that were entered by API consumers. The count indicates the total number of times the word or phrase was searched in the selected timespan. The percentage value on the right indicates the percentage of total searches that were made that included this word or phrase. Click View All in the upper right to see the complete list of queries, as well as more details related to the query. For more information on the page that displays when clicking View All, see below. These queries can contain single words or multiple words, such as
machine learning.What does the term “empty search” stand for?"Empty search" refers to instances where users perform searches with a blank query. It is common to see
<empty search>as one of the top-ranked search queries. - Below the graph is the Top Searches Without Results box. This identifies the top five search words or phrases (queries) that were entered by API consumers, but the search resulted in no APIs. The count indicates the total number of times the word or phrase was searched in the selected timespan. The percentage value on the right indicates the percentage of total searches that were made that included this word or phrase. Click View All in the upper right to see the complete list of queries, as well as more details related to the query. For more information on the page that displays when clicking View All, see below. This information can be used to identify which API(s) are desired by API consumers, but may not be currently on the API Hub. It can also be used to identify keywords that can be added to an existing API's description, tags, or other text-based content in order for a similar API search in the future to result in a search hit for API consumers.
- Below the graph is the Top Results box. This identifies the top five APIs that were returned at any position in searches. You can click on the API name to view more details about the API in the APIs tab of the Admin Panel. The count indicates the total number of times the API was returned in the search results. The percentage value on the right indicates the percentage of times this API was returned in the search results. Click View All in the upper right to see the complete list of APIs that were returned in search results, as well as more details related to the API, such as the percentage of users that clicked on the API. For more information on the page that displays when clicking View All, see below.
Top Searches - View All
1000 resultsThe View All tab includes up to 1000 of the most recent results.
If you click on the View All link in the upper right of the Top Searches area, you are brought to the Searches tab showing details of the top searches, as shown below.
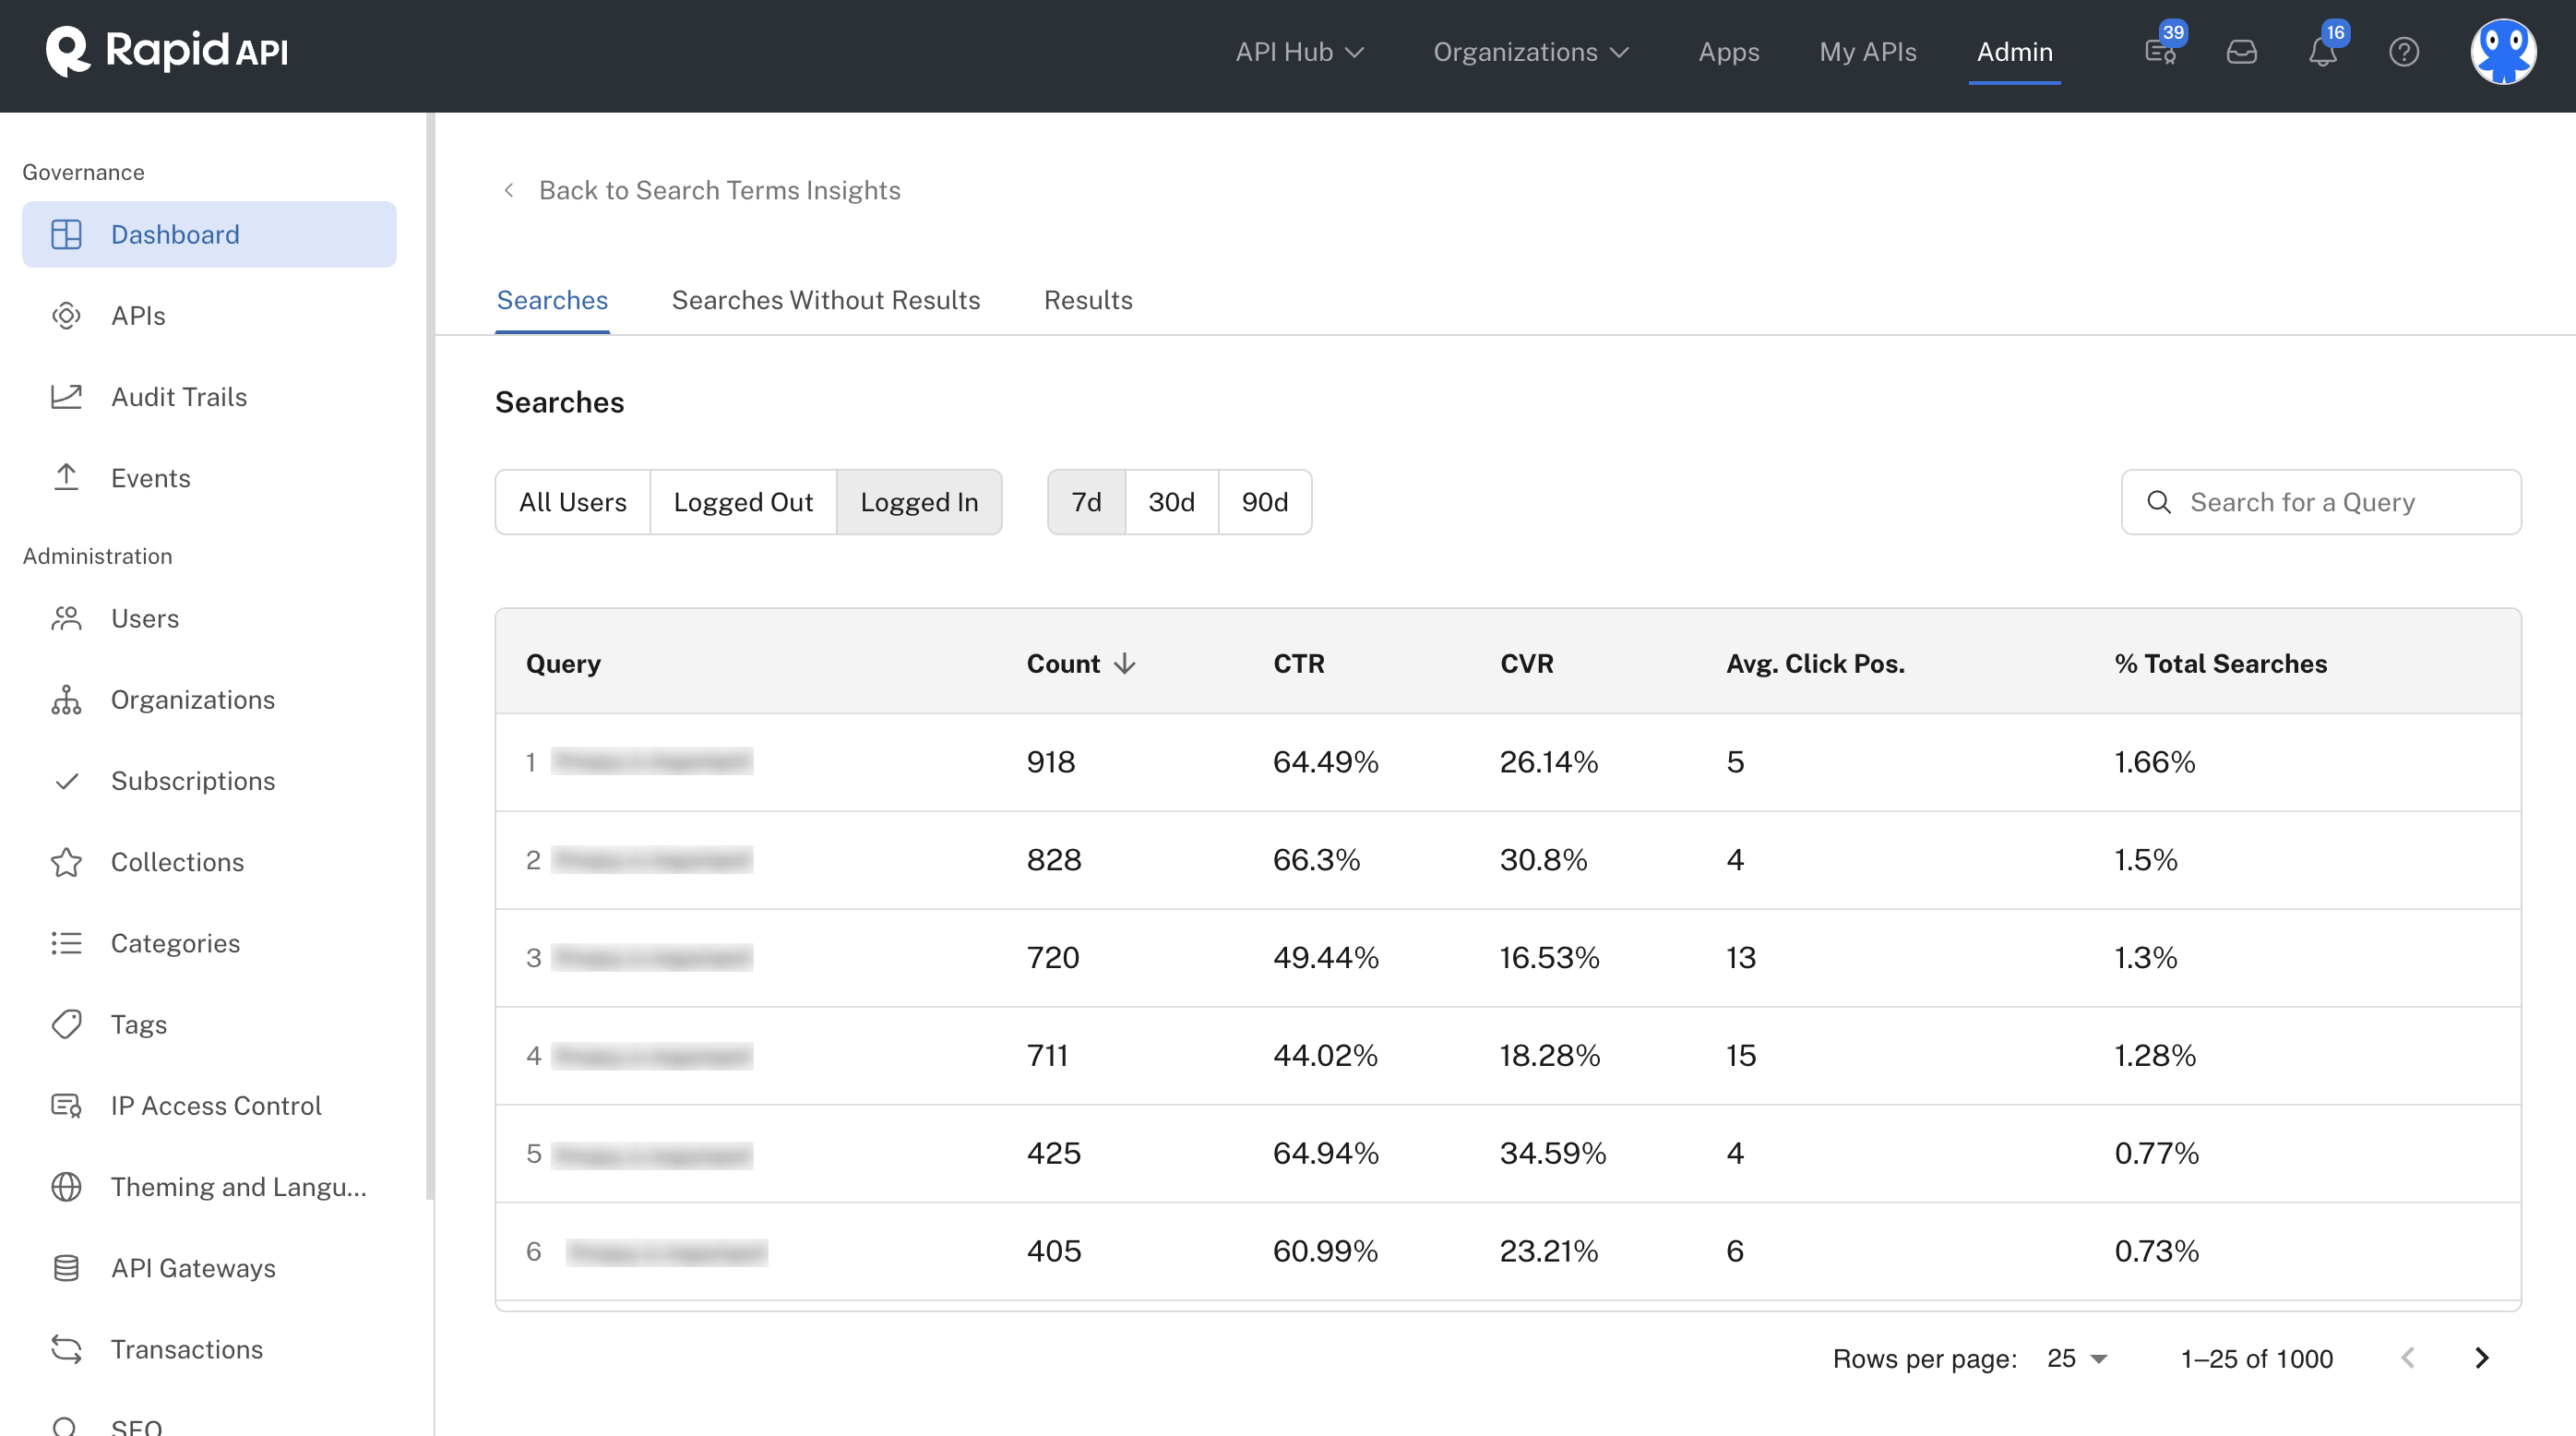
Viewing the details of Top Searches.
This page includes the following features and capabilities
- User Type - Click the All Users button in the top right to display search results for all users, whether the search was executed when a user was logged into the Hub or not. Click the Logged Out button to display only results for users that have not logged into the Hub. Click the Logged In button to display only results for users that are logged into the Hub when executing the search. In the screenshot above, results are display only for logged in users.
- Timespan - Click the 7d, 30d, or 90d button in the upper right to display the results for 7 days, 30 days, or 90 days. The screenshot above displays 7 days of results.
- Search box - Use the search box in the upper right to limit the results to specific words or phrases. This is especially helpful because if your Hub has high usage, there could be many pages of results.
- Sortable columns - Click any column header in the table to sort by that column. Click the column header again to change the sorting order.
- Query - Lists the word or phrase entered by the API consumer when searching for APIs.
- Count - The total number of times the word or phrase was searched in the selected timespan.
- Click Through Rate (CTR) - The percentage of times after searching for the word or phrase that the API consumer clicked on at least one API in the search results.
- Conversion Rate (CVR) - The percentage of times a user searched for a word or phrase, clicked on at least one API, then subscribed to at least one of the APIs.
- Average Click Position - The average API search result position that the API consumer clicks for the selected word or phrase. For example, an average click position of
5for a word or phrase means that, for that query, the consumer on average clicked on the 5th API in the results. A high average click position for a query may indicate that the most desirable API related to the query is currently a bit difficult for users to find. To improve this number, you could add the searched word or phrase to one or more existing API's description, tags, or other text-based content in order for a similar API search in the future to result in a more relevant API appearing higher in the results. - Percent Total Searches - The percentage of total searches in which the word or phrase was made. Higher percentages mean that the word or phrase is popular and/or may be trending. As a result, you may want to add more content related to the search to the Hub.
- Paginated results - Use the pagination controls in the lower right to change the number of results per page, and to navigate through the pages.
Top Searches Without Results - View All
1000 resultsThe View All tab includes up to 1000 of the most recent results.
If you click on the View All link in the upper right of the Top Searches Without Results area, you are brought to the Searches Without Results tab showing details of the searches that returned no APIs in the results, as shown below.
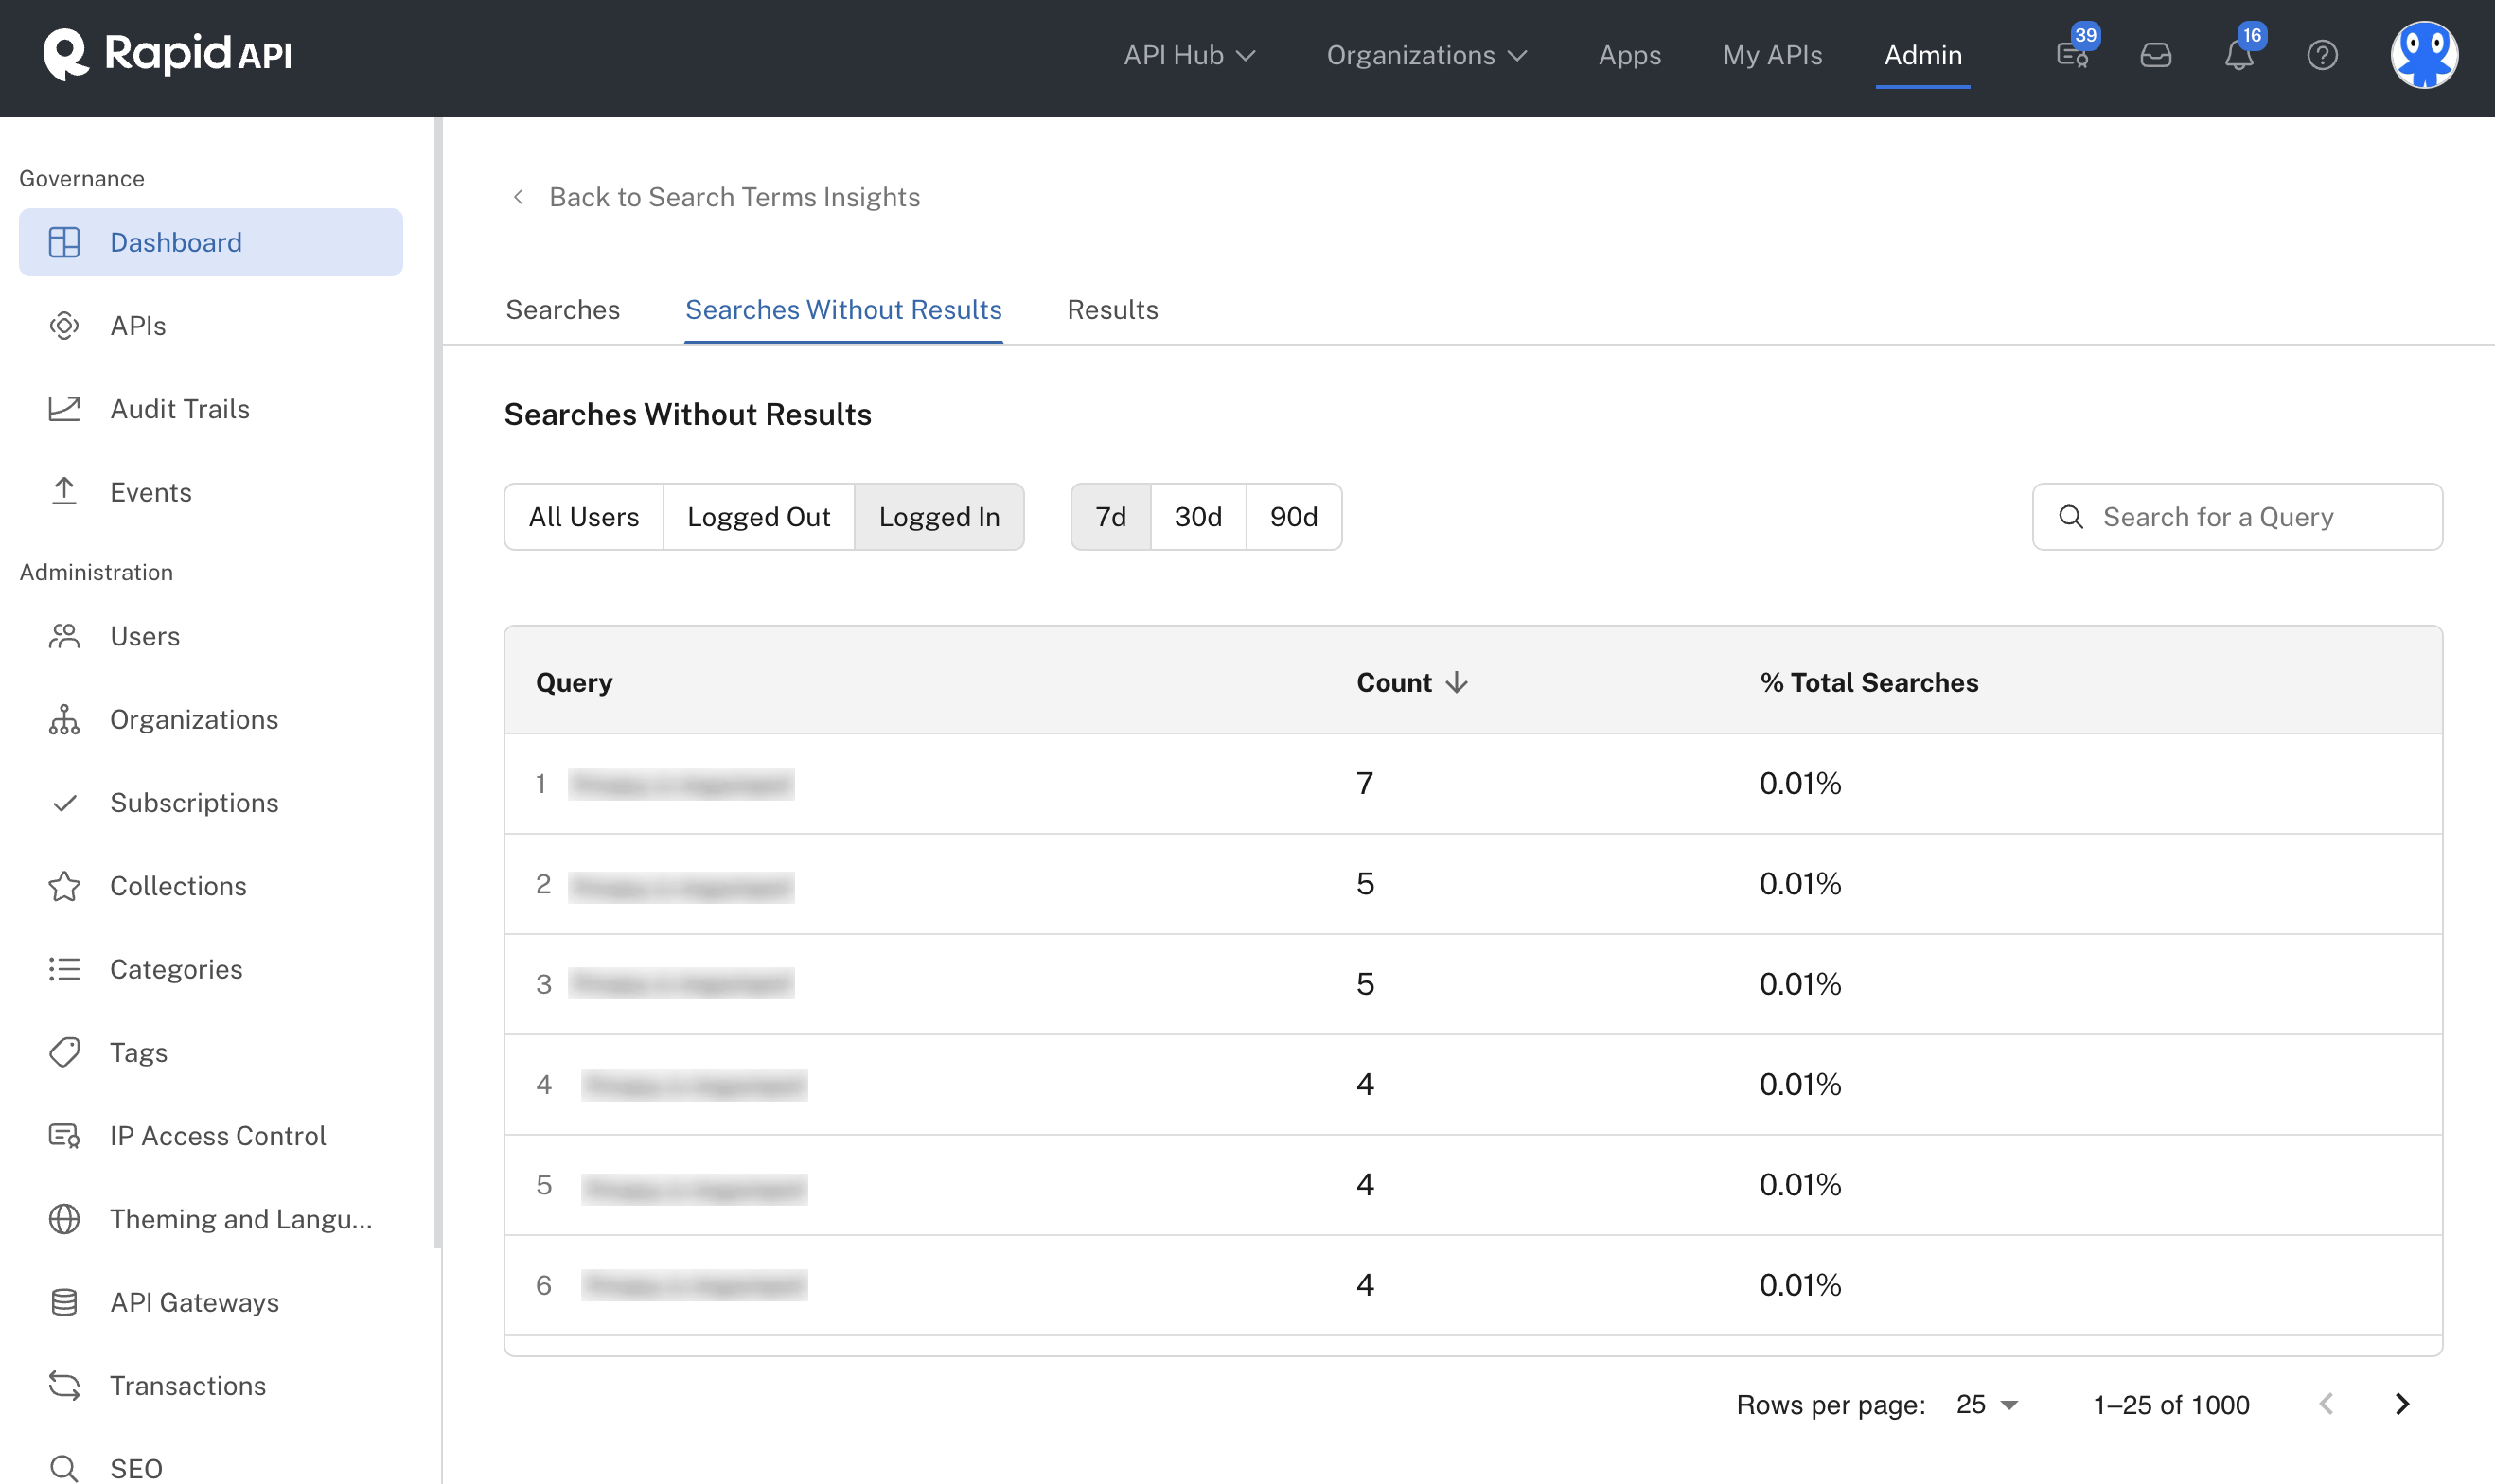
Viewing the details of Searches Without Results.
This page includes the following features and capabilities
- User Type - Click the All Users button in the top right to display search results for all users, whether the search was executed when a user was logged into the Hub or not. Click the Logged Out button to display only results for users that have not logged into the Hub. Click the Logged In button to display only results for users that are logged into the Hub when executing the search. In the screenshot above, results are display only for logged in users.
- Timespan - Click the 7d, 30d, or 90d button in the upper right to display the results for 7 days, 30 days, or 90 days. The screenshot above displays 7 days of results.
- Search box - Use the search box in the upper right to limit the results to specific words or phrases. This is especially helpful because if your Hub has high usage, there could be many pages of results.
- Sortable columns - Click any column header in the table to sort by that column. Click the column header again to change the sorting order.
- Query - Lists the word or phrase entered by the API consumer when searching for APIs.
- Count - The total number of times the word or phrase was searched and had no API results.
- Percent Total Searches - The percentage of total searches in which the word or phrase was made. Higher percentages mean that the word or phrase is popular and/or may be trending. As a result, you may want to add more content related to the search to the Hub.
- Paginated results - Use the pagination controls in the lower right to change the number of results per page, and to navigate through the pages.
Top Results - View All
1000 resultsThe View All tab includes up to 1000 of the most recent results.
If you click on the View All link in the upper right of the Top Results area, you are brought to the Results tab showing details of the APIs returned in the search results, as shown below.
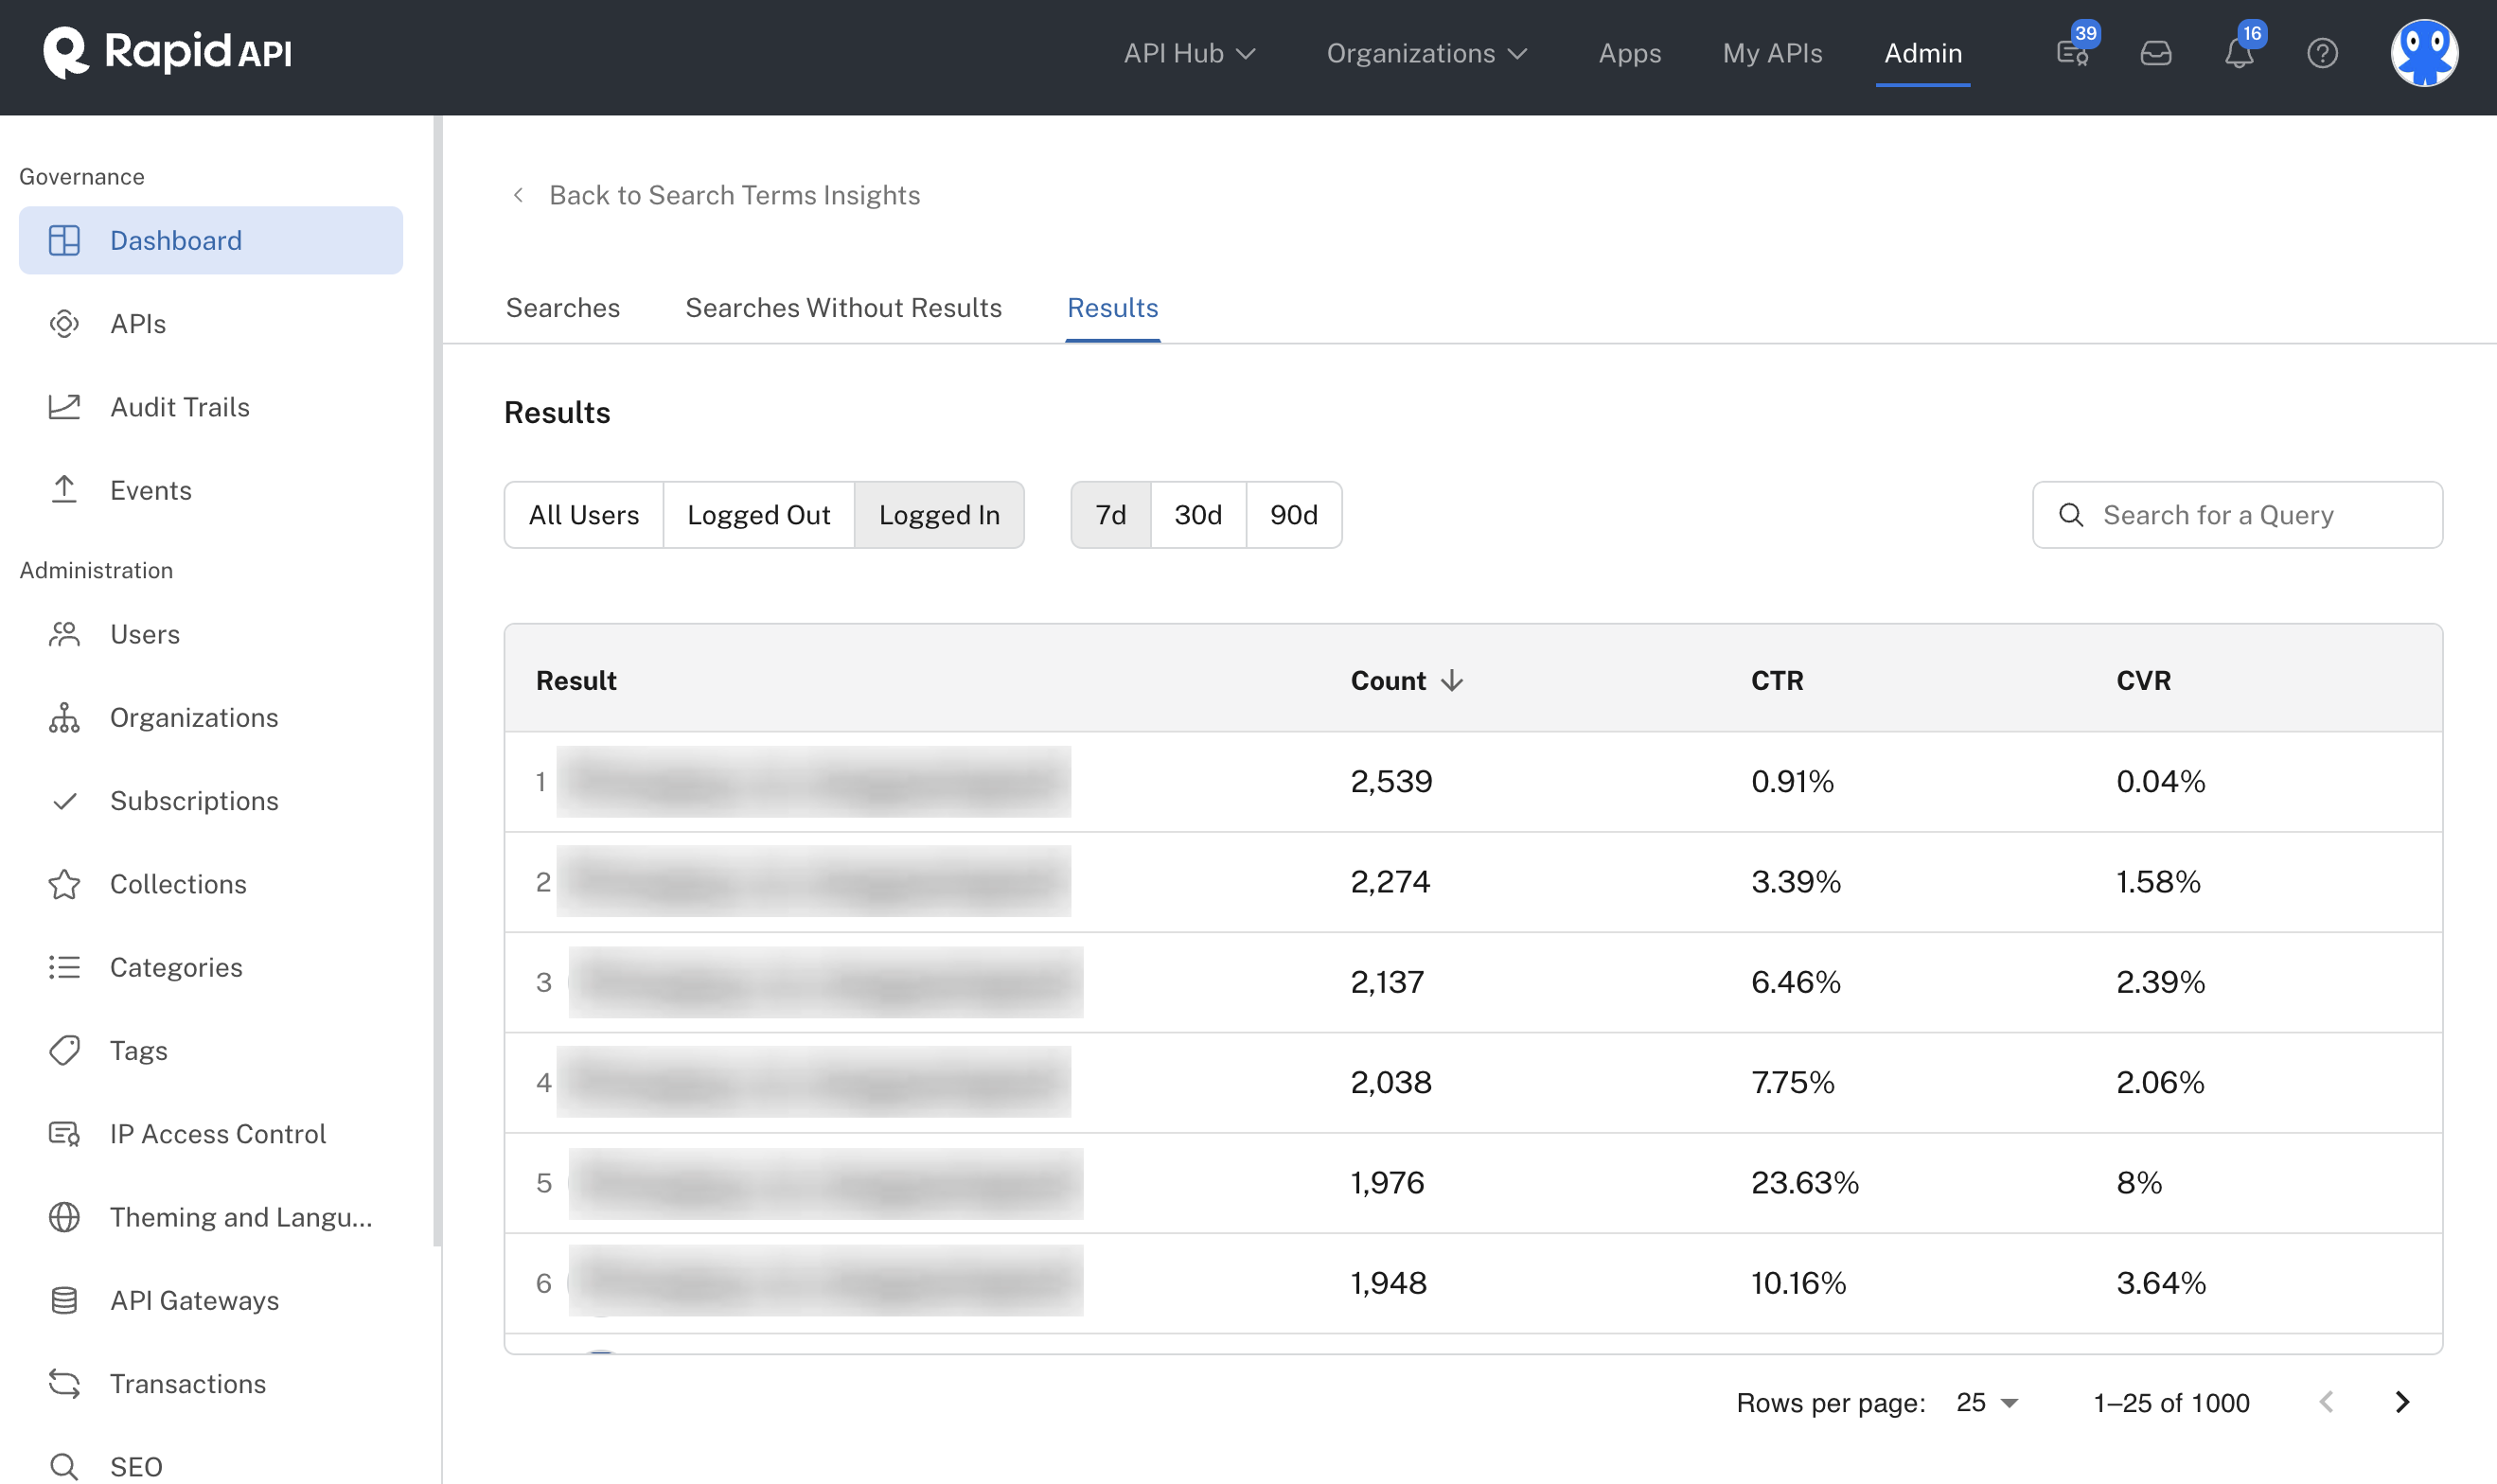
Viewing the details of Top Results.
This page includes the following features and capabilities
- User Type - Click the All Users button in the top right to display search results for all users, whether the search was executed when a user was logged into the Hub or not. Click the Logged Out button to display only results for users that have not logged into the Hub. Click the Logged In button to display only results for users that are logged into the Hub when executing the search. In the screenshot above, results are display only for logged in users.
- Timespan - Click the 7d, 30d, or 90d button in the upper right to display the results for 7 days, 30 days, or 90 days. The screenshot above displays 7 days of results.
- Search box - Use the search box in the upper right to limit the results to specific APIs. This is especially helpful because if your Hub has high usage, there could be many pages of results.
- Sortable columns - Click any column header in the table to sort by that column. Click the column header again to change the sorting order.
- Result - Lists the API that was returned when searching for APIs. You can click on the API name to view more details about the API in the APIs tab of the Admin Panel.
- Count - The total number of times the API was returned at any position in the search results.
- Click Through Rate (CTR) - The percentage of times after searching for the word or phrase that the API consumer clicked on the API in the search results.
- Conversion Rate (CVR) - The percentage of times a user searched for a word or phrase, clicked on the API listed here, then subscribed to the API.
- Paginated results - Use the pagination controls in the lower right to change the number of results per page, and to navigate through the pages.
Updated about 1 year ago