
Consuming GraphQL APIs
Execute GraphQL API queries from the API listing.
Overview
GraphQL APIs have a different architectural style than other common types of APIs, such as REST APIs. For example, a GraphQL API typically has a single HTTP POST endpoint, and the body of the request defines the specifics of the query (reading data) or mutation (changing data). Because of this, Rapid offers a unique API consumer experience for GraphQL APIs.
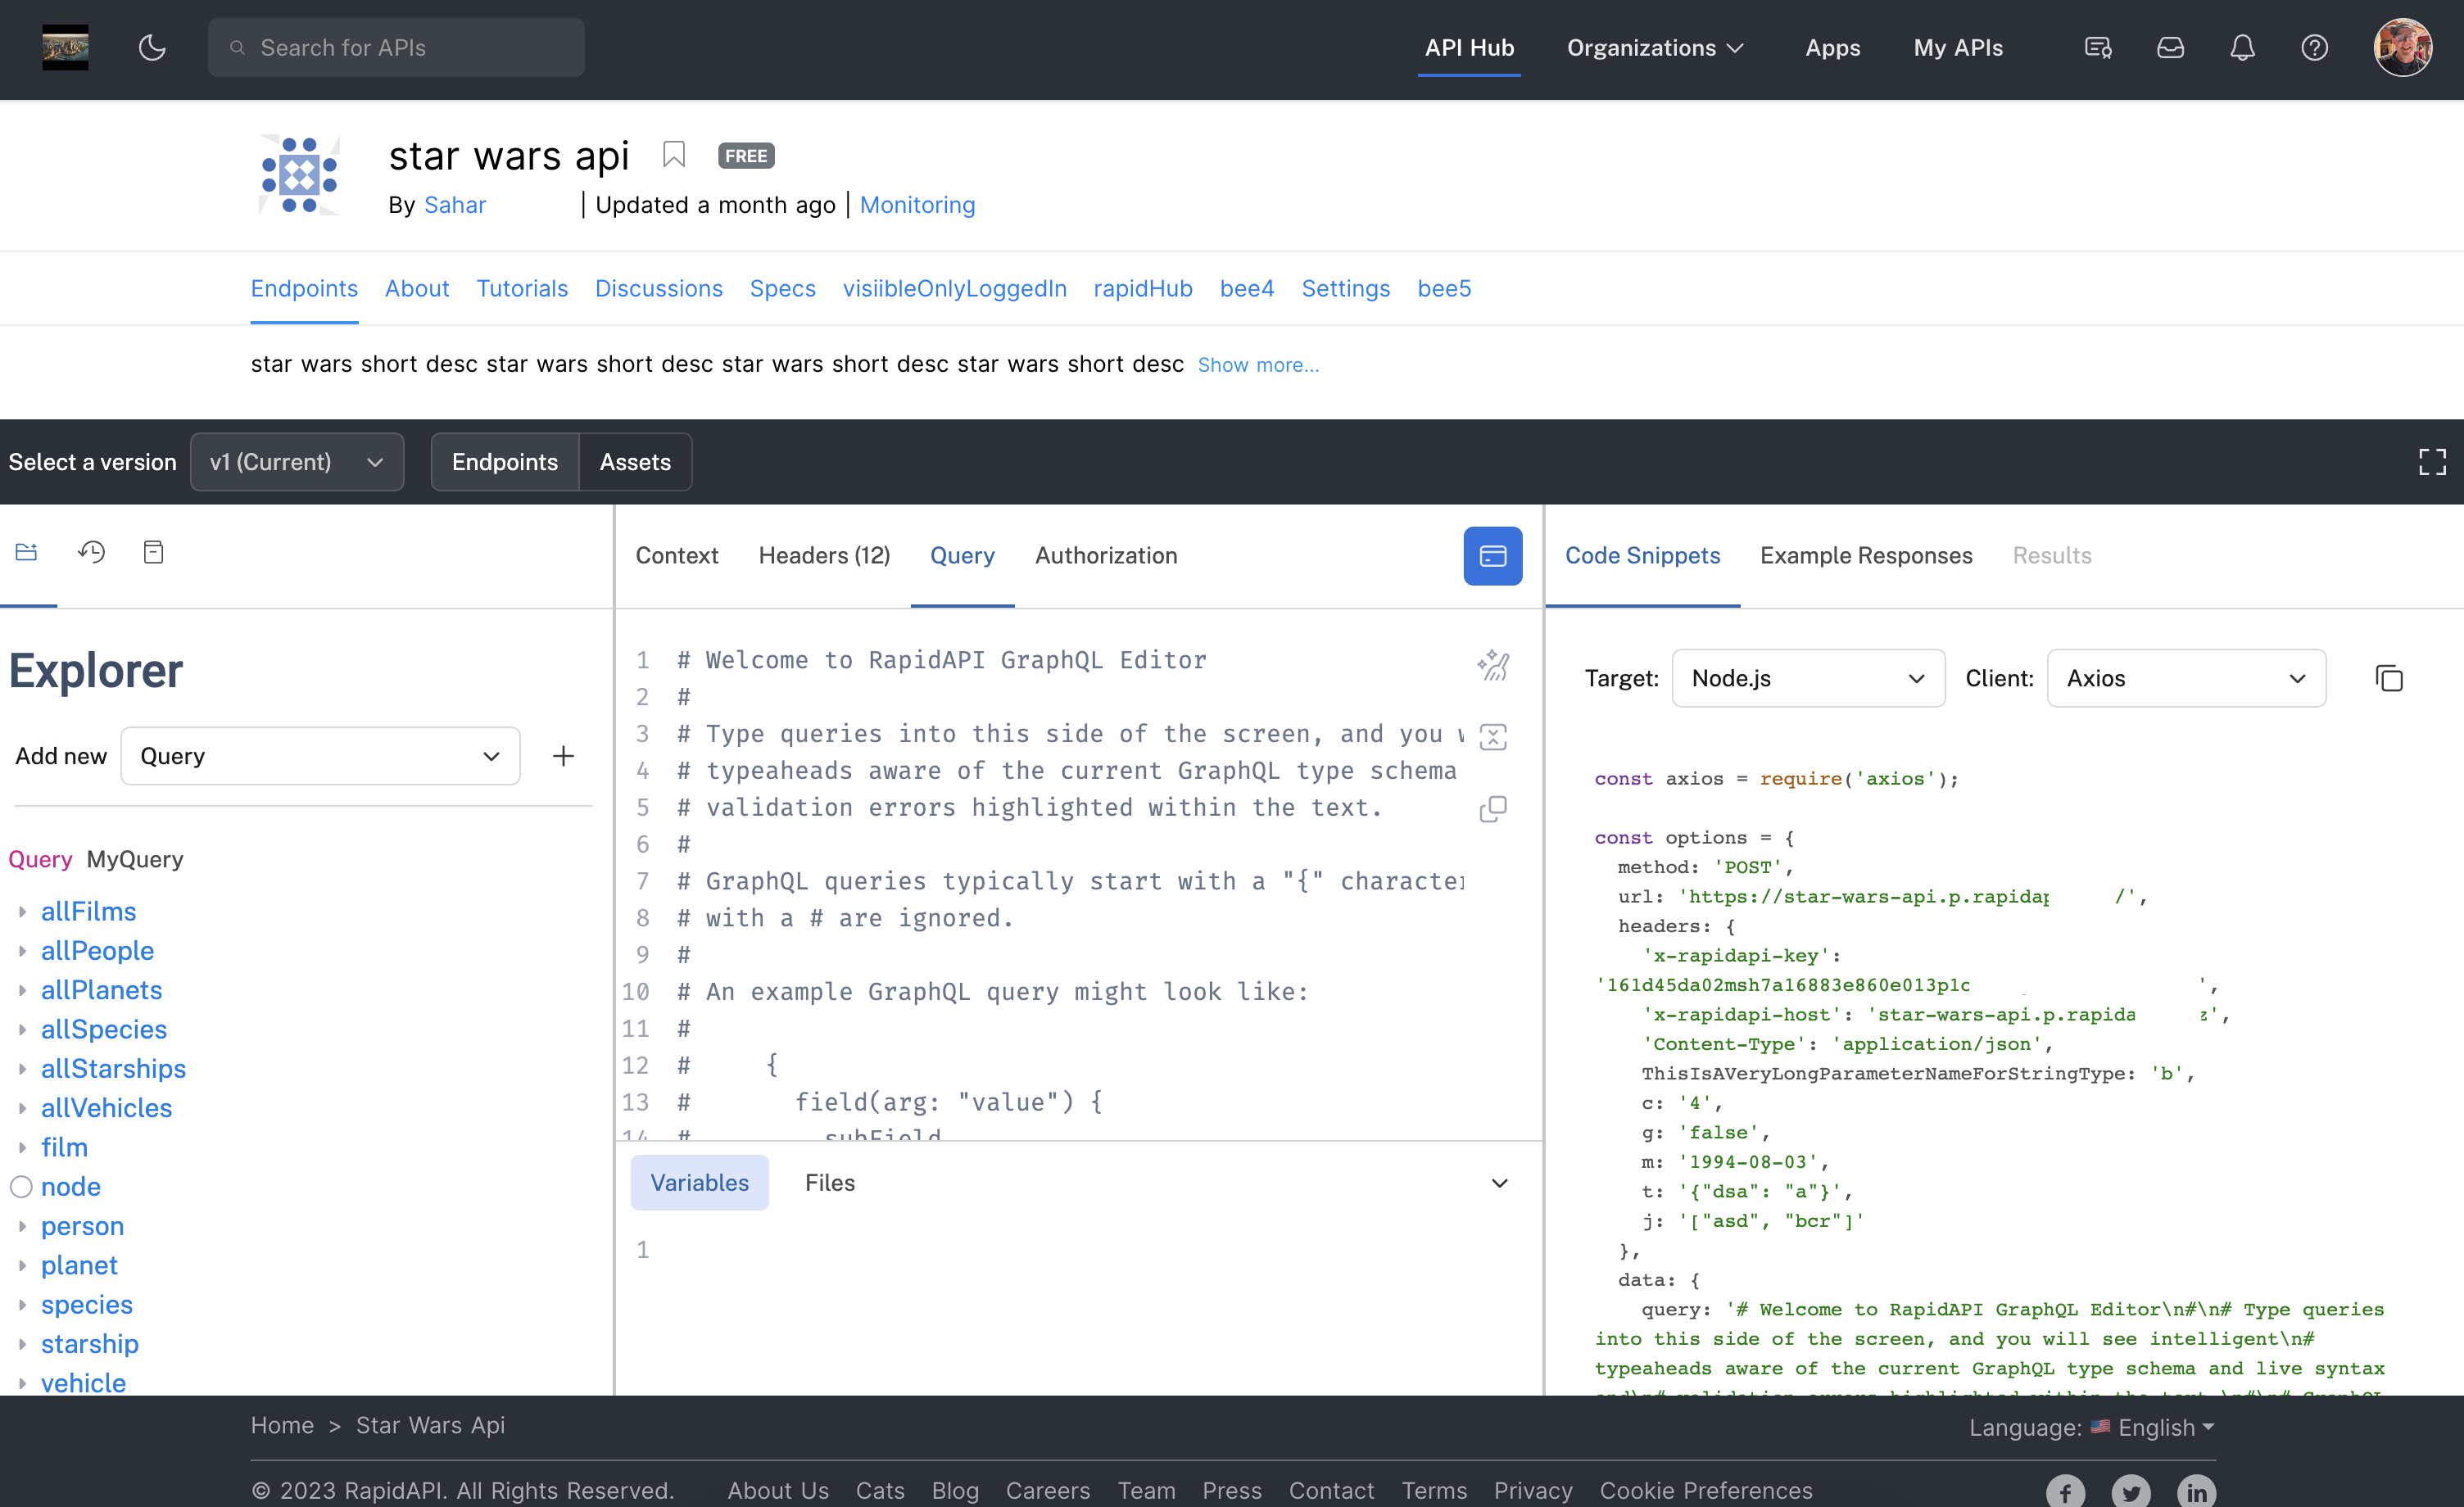
The API consumer experience when viewing a GraphQL API.
In Rapid, GraphQL APIs use an editor based on an industry-standard editor named GraphiQL. This editor has been customized and enhanced to work well with GraphQL APIs on Rapid.
To effectively work with GraphQL API queries, it is suggested that you click the icon on the right of the center bar to use more of your screen for queries, as shown below.
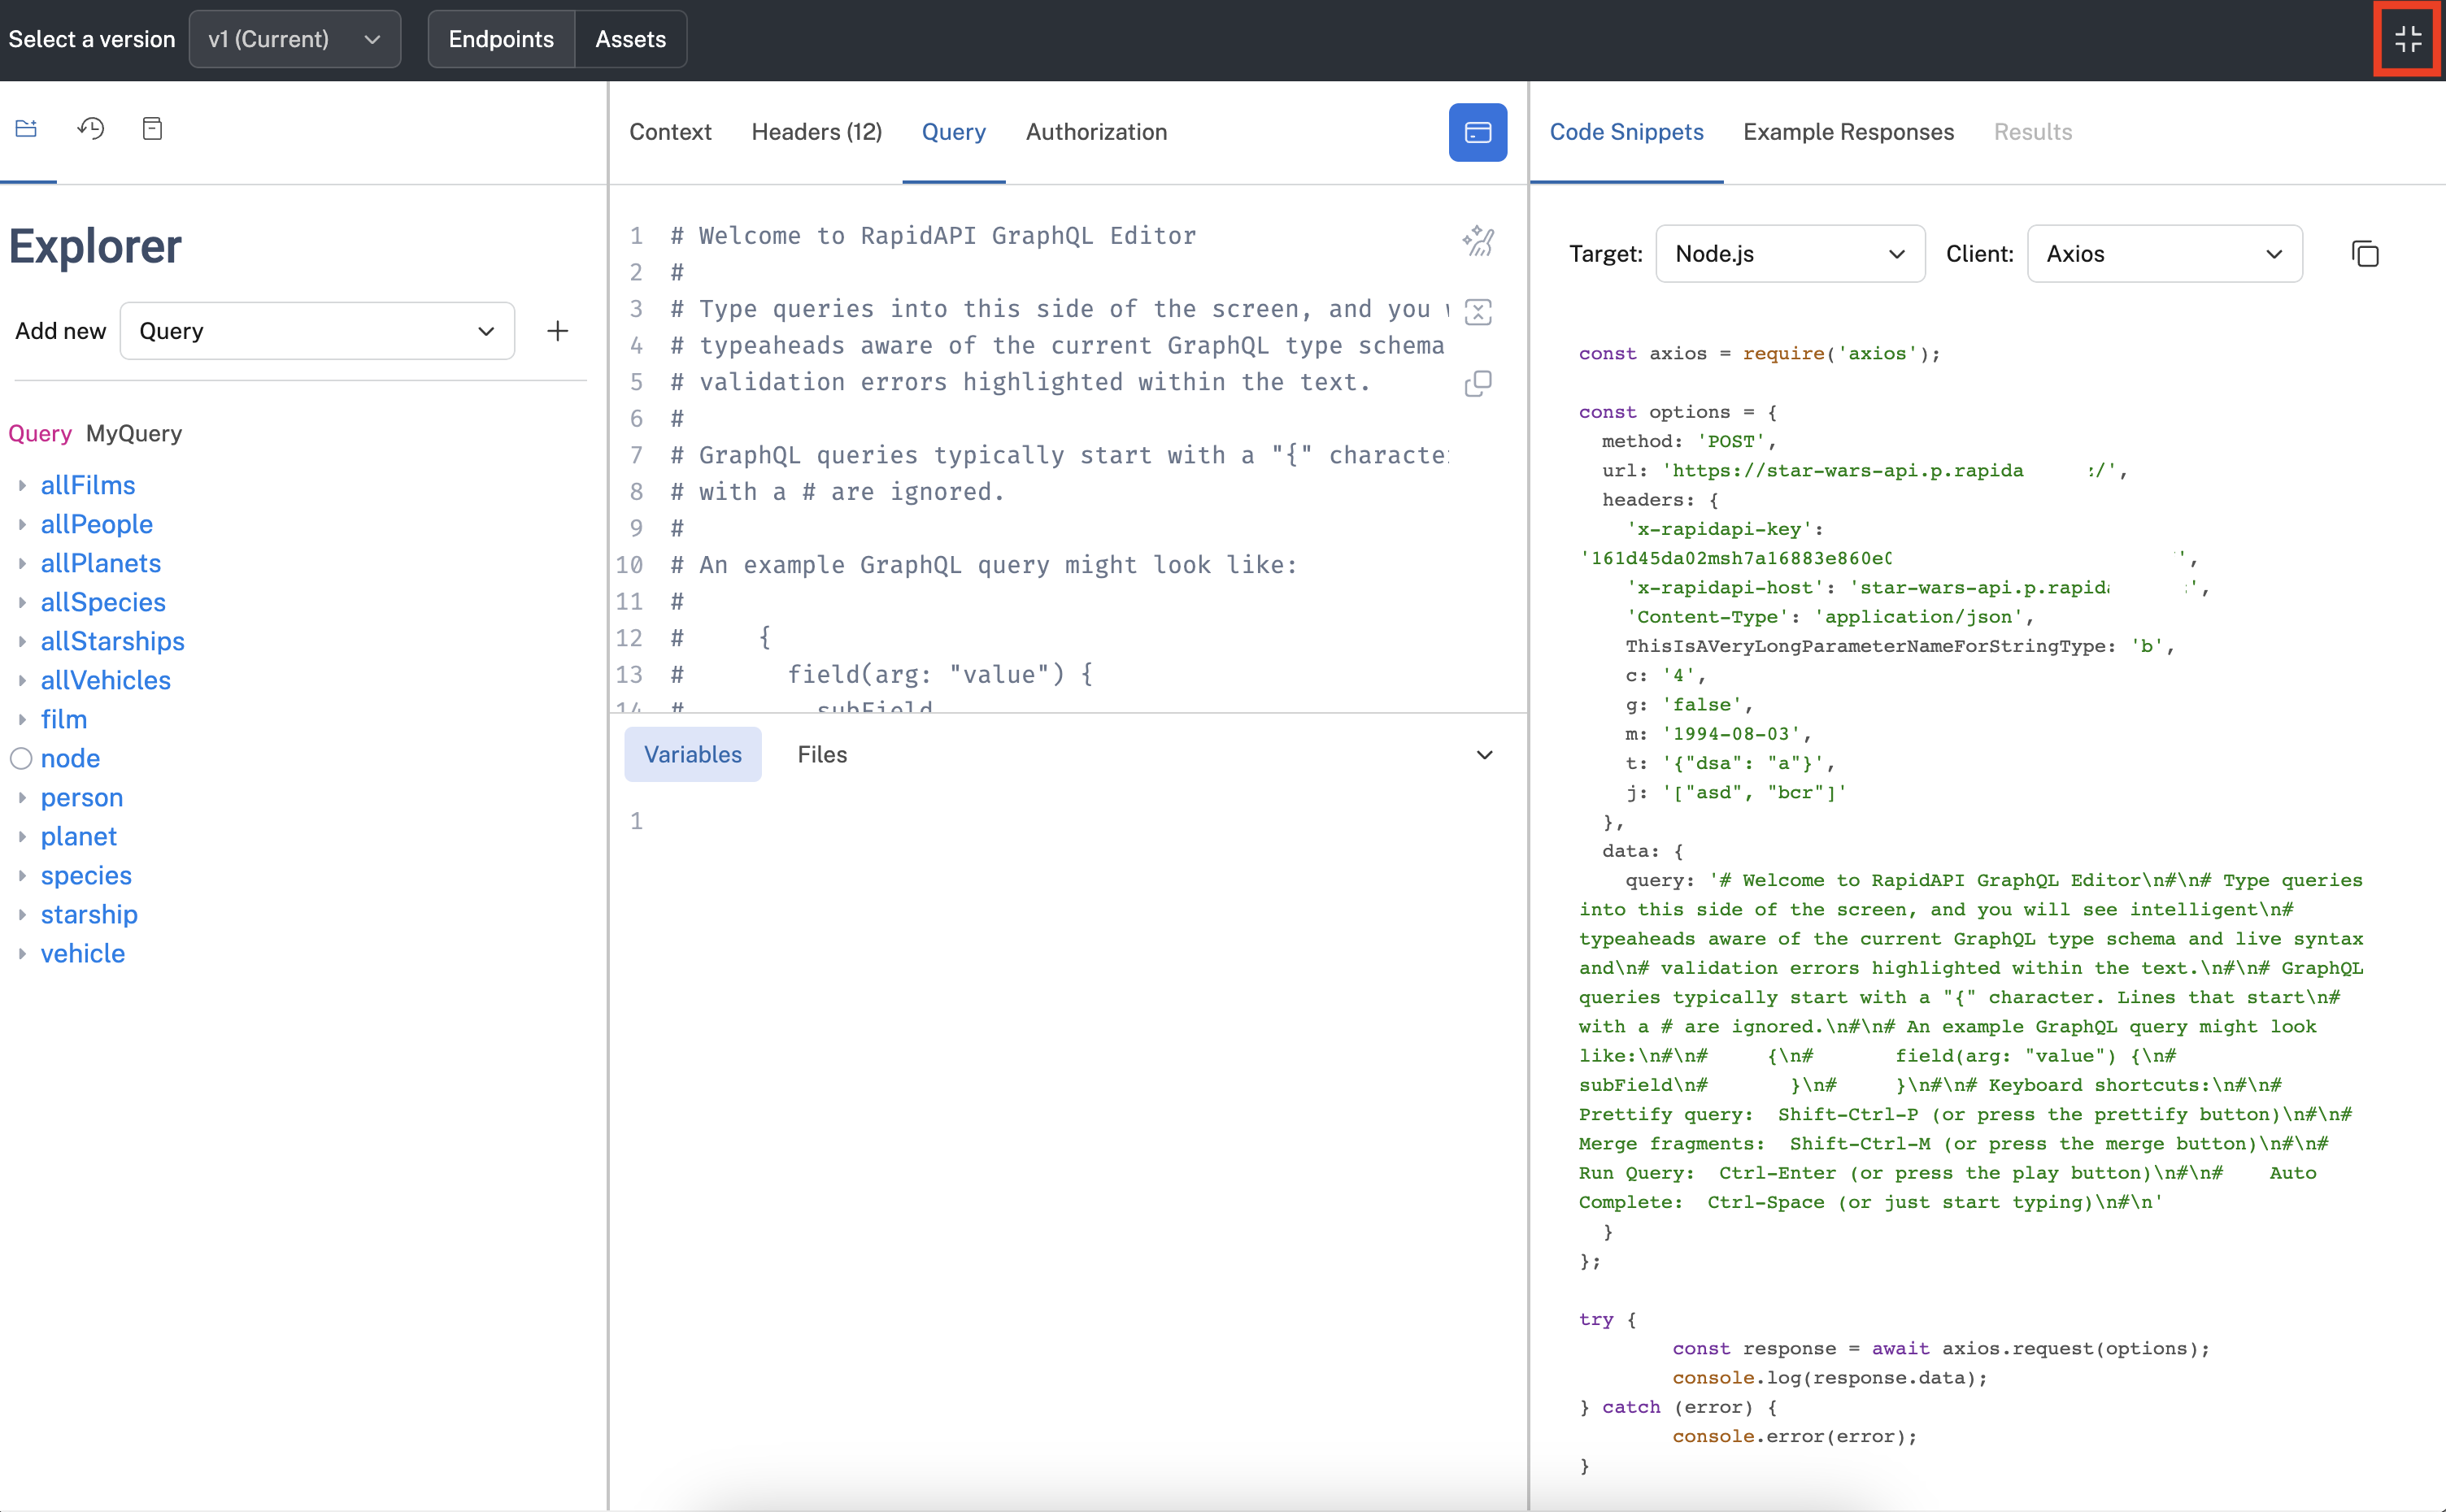
The GraphQL editor after clicking the icon on the right to expand the editor.
Each of the three main frames (left, center, and right) shown above is described below.
Left frame
The left frame has three modes:
- Explorer - Uses an easy-to-use user interface to help create queries and mutations for the API.
- History - A list of queries or mutations you have made for the API.
- Docs - Used to browse and navigate the schema documentation for the API.
Left frame - Explorer mode
Click the left icon in the left frame to access the Explorer mode for building queries and mutations. To build a query, simply click on a query or mutation on the left and you will see the query editor in the Query tab in the center begin to populate. For example, the screenshot below shows the query that is starting to be built by clicking the allFilms query.
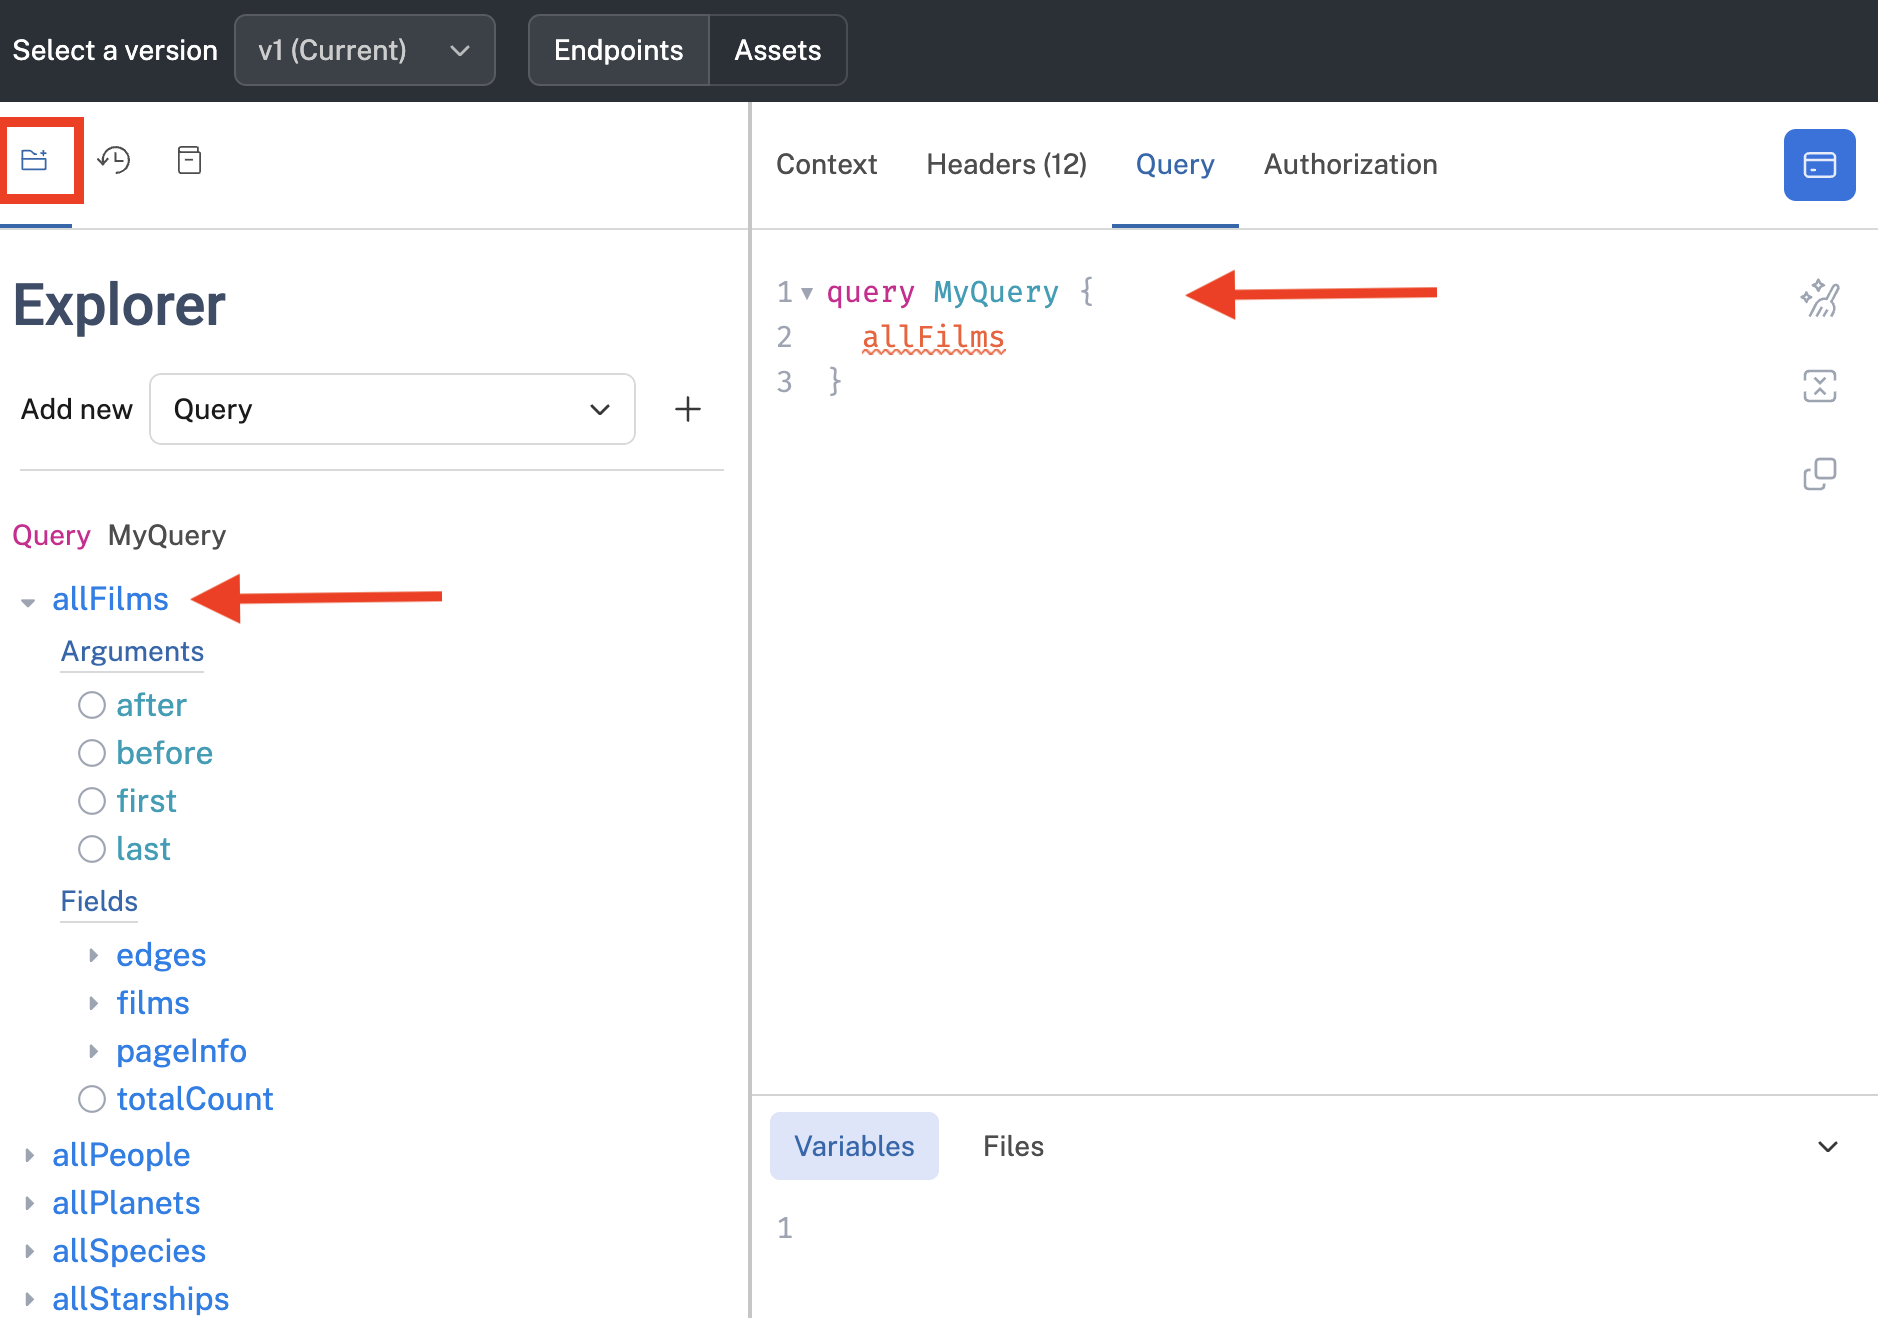
Using the Explorer mode of the left frame to help build a query.
Notice the the query editor underlines allFilms, indicating that the allFilms query is not complete enough to execute successfully. You can hover over allFilms to see information to help complete the query.
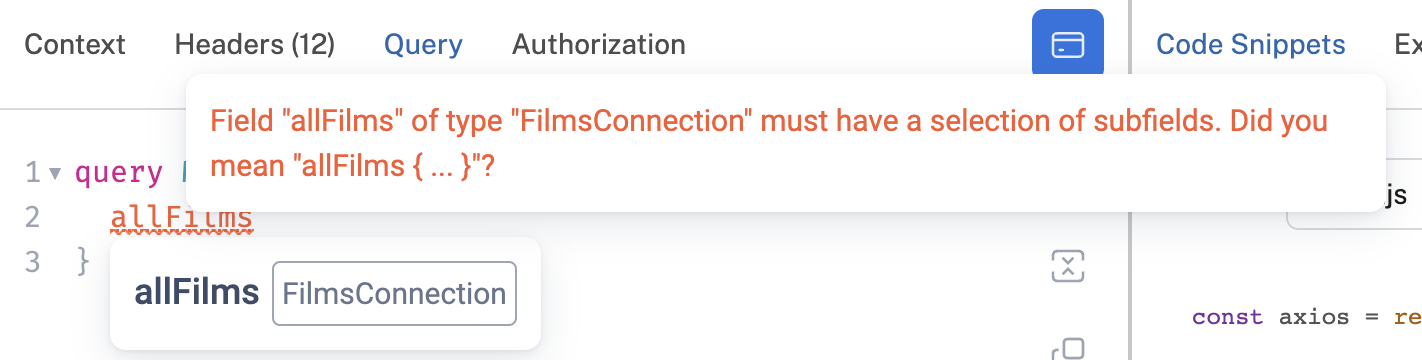
Highlighting the error in the query editor displays helpful information.
Multiple queries per operation
If your API supports multiple queries (or mutations) per operation, you can build these operations in Explorer mode. This is sometimes known as "query batching".
The Explorer frame can contain one or more operation. For example, an operation named MyQuery is shown below. If you click on a query under the MyQuery operation, it will be added inside the operation. In the example below, we have clicked on both countries and continents queries under the MyQuery operation. In the query editor, you can see both the of these queries in the operation. Executing this query returns results in both a countries object and a continents object.
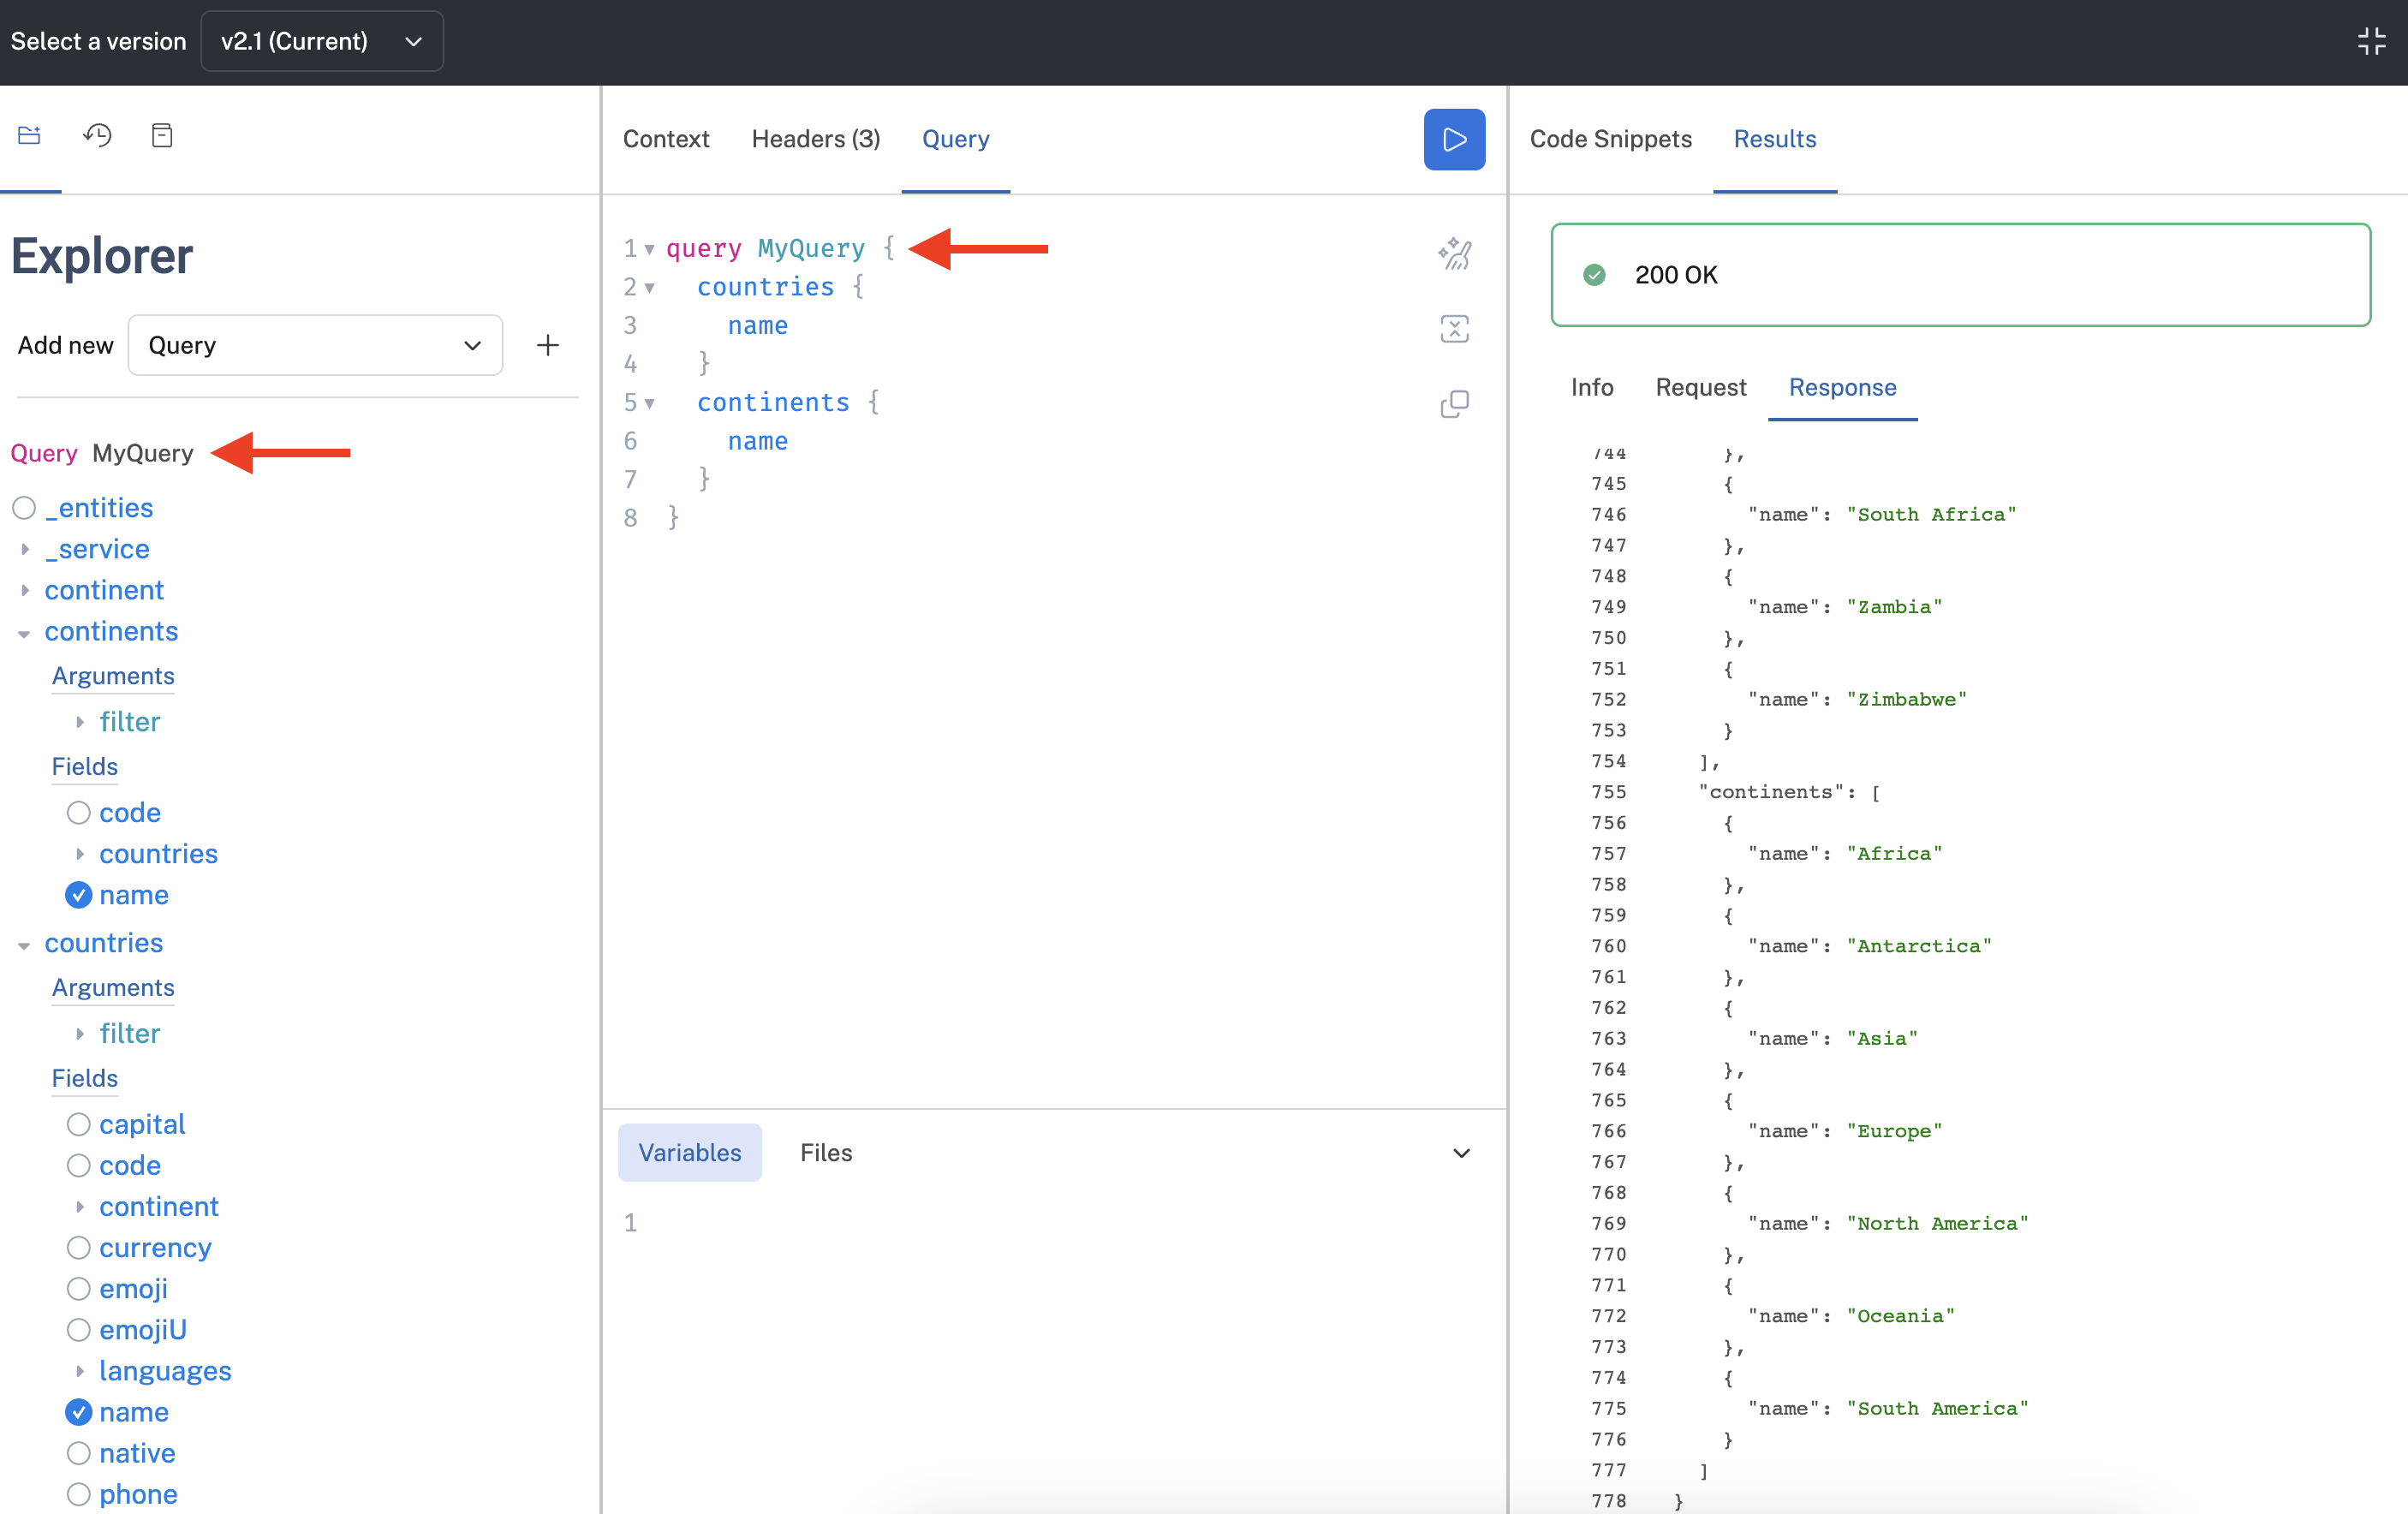
A single operation named MyQuery containing two queries.
Multiple operations per execution
You can execute multiple operations in a single execution by using the Add new dropdown in the upper part of the left frame. Each operation is uniquely named, and has a complete set of user interface elements to choose from.
In the example below, we added a new query named MyQuery2. Clicking the execute button executes both operations, in this case displaying continents using MyQuery1 and countries using MyQuery2.
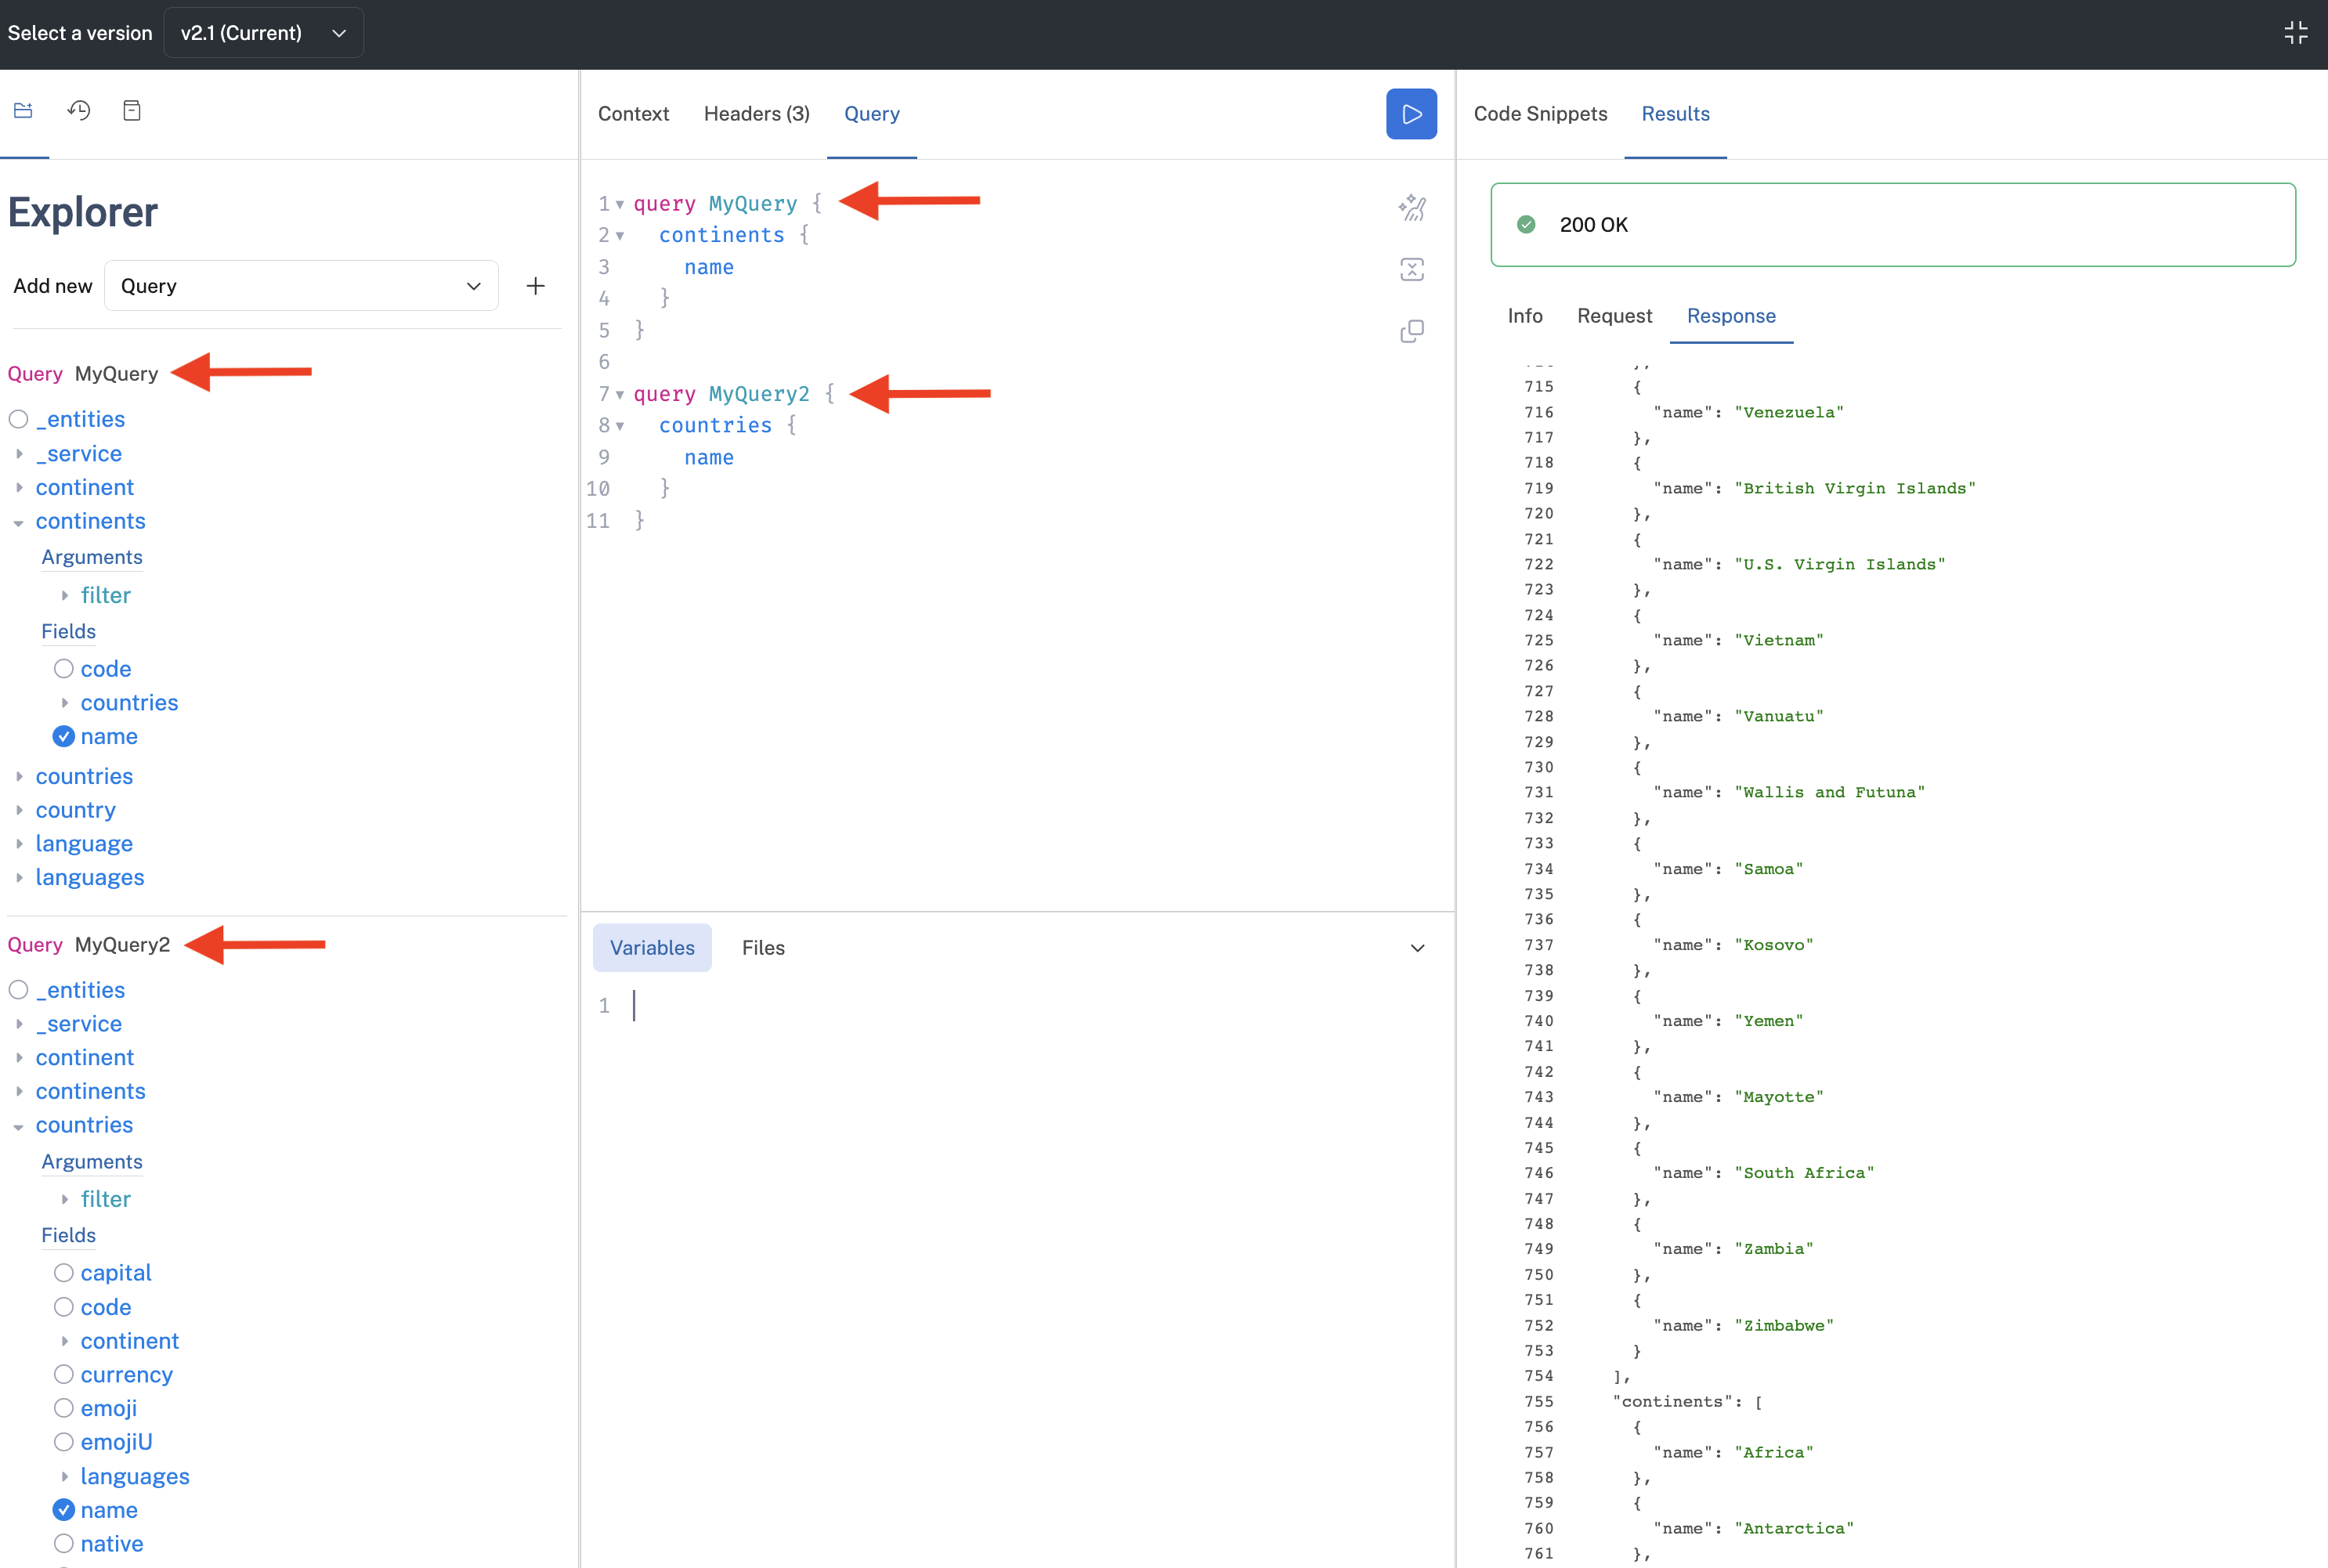
Multiple operations for a single execution.
If you hover over the name of the operation in Explorer view, you will see two icons (as shown below).
- Click the trash icon to delete the operation.
- Click the second icon to copy the operation. It will be created at the bottom of the Explorer view with a name like
MyQueryCopy. You will also see the copied operation in the query editor in the middle frame.
Hover over the operation name to see the delete and copy options.
Left frame - History mode
Clicking the history icon in the left frame (the second icon at the top of the left frame below) displays a list of previous queries you have executed for the API (if any). This list is automatically populated as you execute queries (or mutations). In this mode, you can perform the following actions:
- Click on an operation in the history list to display the operation in the query editor in the middle frame. This will replace any previous operation in the query editor. The operation name is displayed in the list. For example, in the screenshot below, the operation is of type
queryand is namedmyPing. If the operation is not named, the first portion of the query is displayed (for example, in. the last query of the list below). The name in the History list can be changed by clicking the pencil icon next to the operation (see the first of three icons outlined below). Changing the name in the history list will not change the operation name in the query editor. - Click the Clear button to the right of the History label to clear the history list.
- Click the pencil icon next to the query (see the first of three icons outlined below) to change the name of the operation in the history list. Changing the name in the history list will not change the operation name in the query editor. However, changing the name of the operation in the query editor of the middle frame will change the name of the operation in history, so this is the recommended way to change the operation name.
- Click the star icon next to the query (see the second of three icons outlined below) to mark the operation as a favorite. This will move and stick the operation to the top of the history list, as shown with the
myPingoperation below. - Click the recycle icon next to the operation (see the third of three icons outlined below) to delete the operation from the history list.
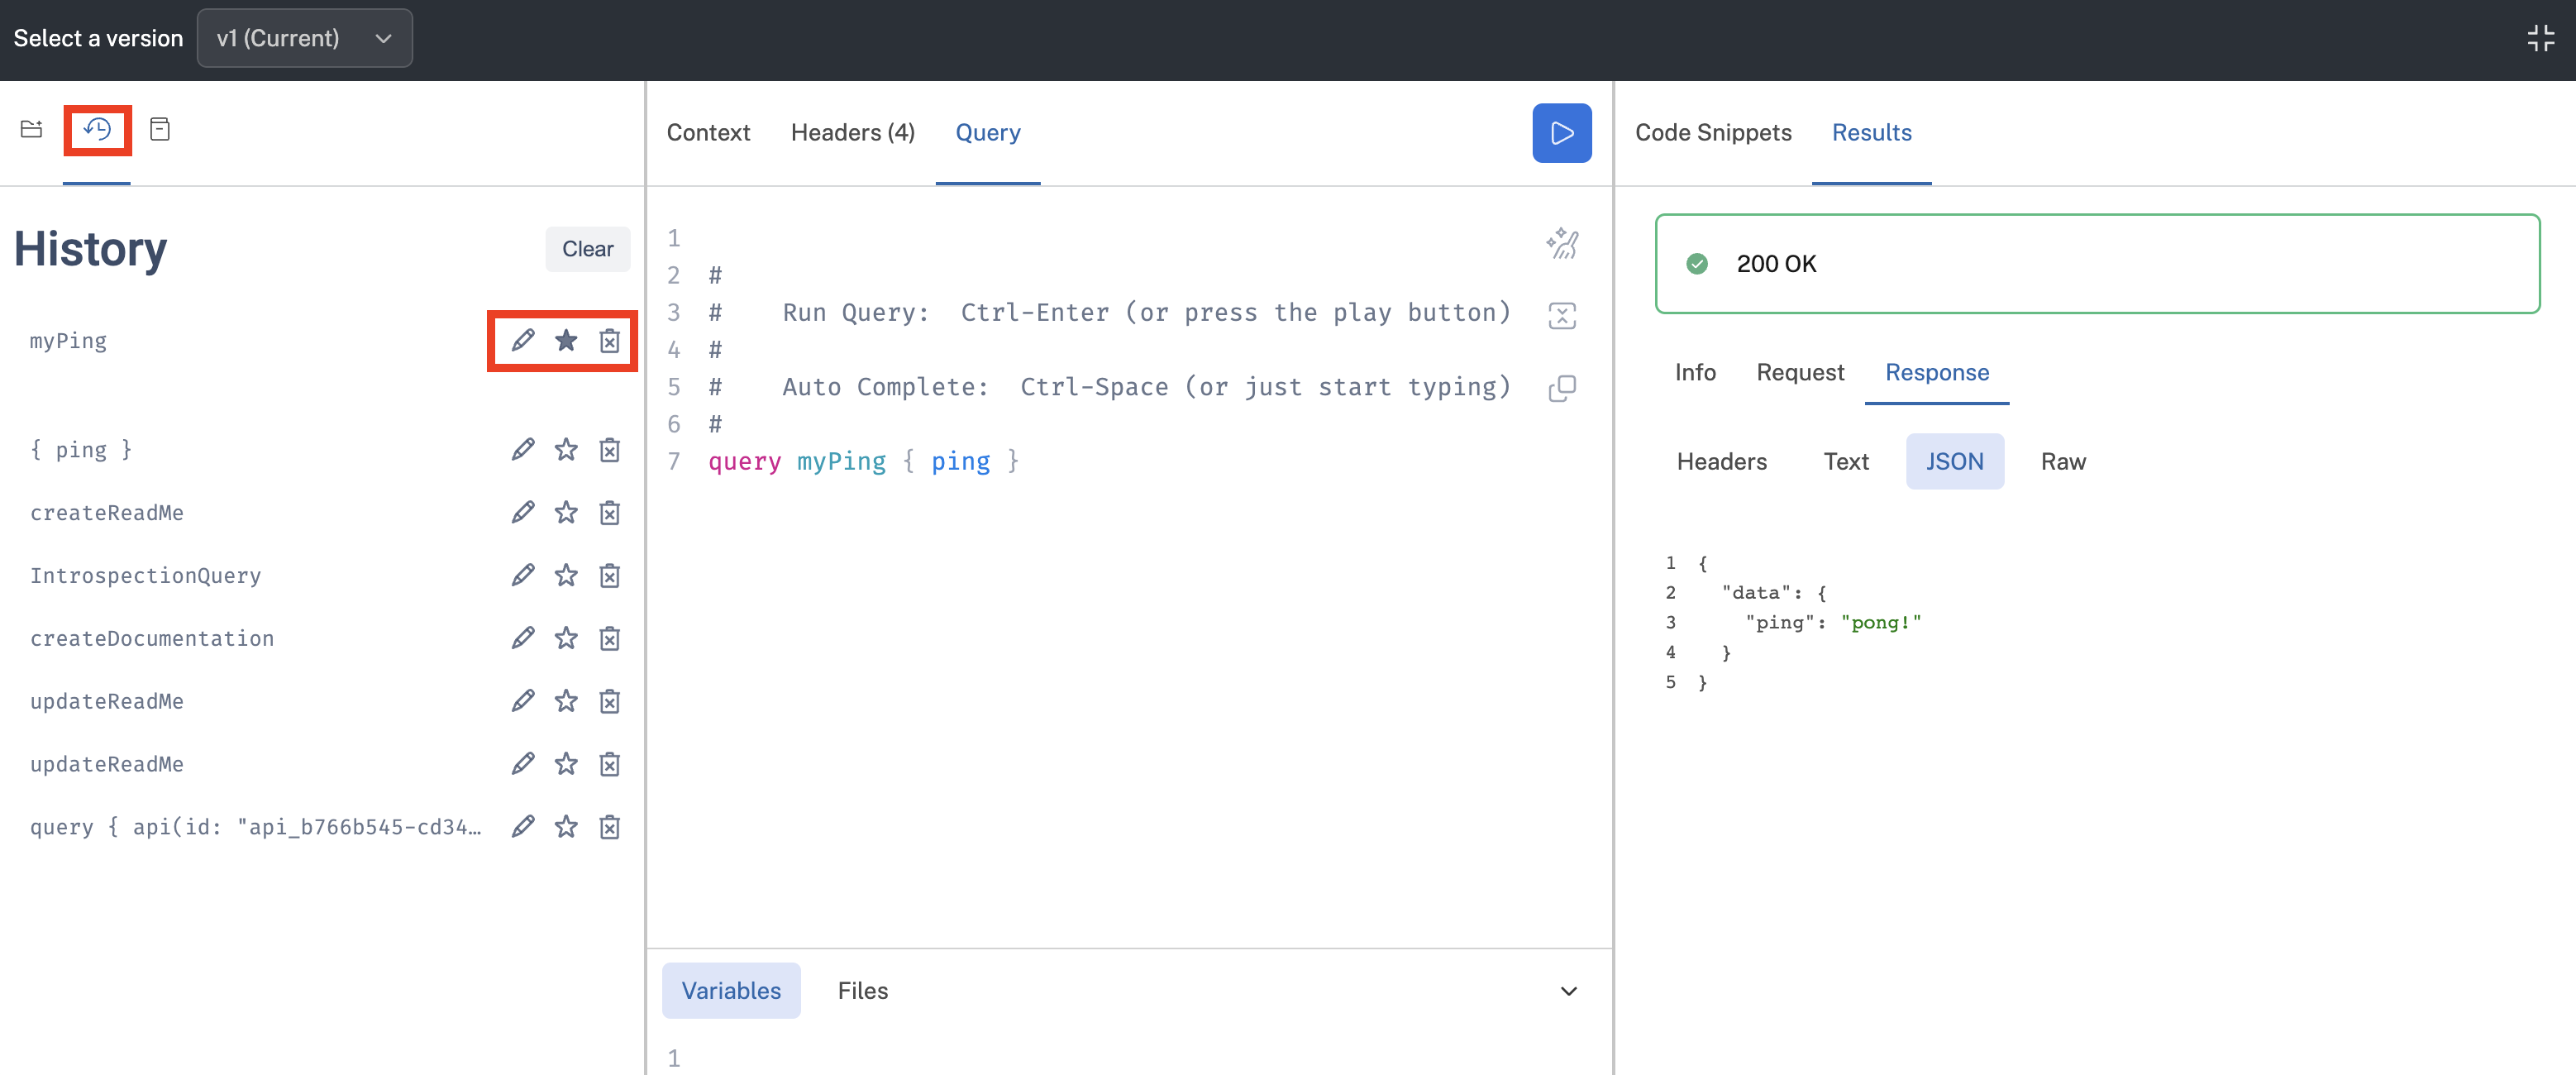
Using the History mode to view or execute previous queries.
History limitationsThe history list is stored in a browser cookie. This means that the history is only applicable for the current browser. For example, if you opened an incognito browser window and logged in as the same user, the same history will not be shown (the history would be empty).
Only the query and variables are saved in history. Other values such as context, headers, and files are not saved in the history.
Left frame - Docs mode
Clicking the Docs icon in the left frame (the third icon at the top of the screenshot below) displays a linkable version of API's GraphQL schema.
You can click the search icon in the upper right (or press CTRL K) to search the schema. The field names and types are clickable, so that you can view more information about the query. In the example below, we could click on the countries field to explore it further, or directly click on the CountryFilterInput argument type or Country return type to view their details.
Note that navigating in docs mode does not change the query in the query editor of the middle frame. However, Explorer mode (the left icon at the top) does this.
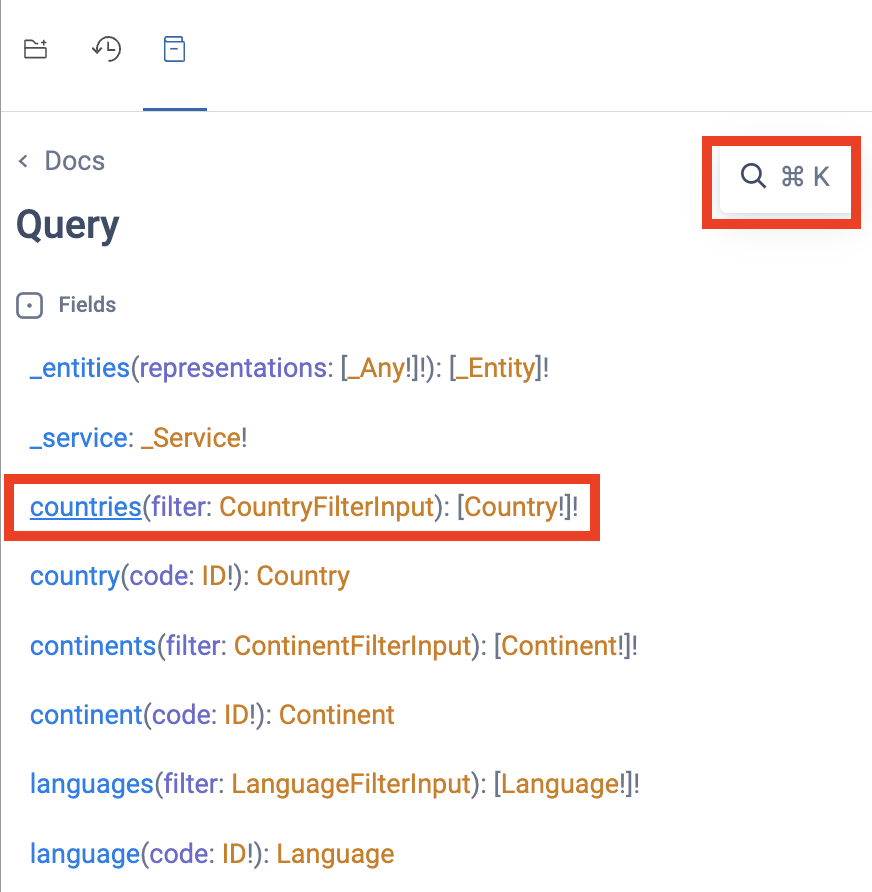
Docs mode in the left frame.
Center frame
The center frame has four main tabs and one execution button:
Center frame - Context tab
The Context tab is where you select the user or team that will execute the query. This changes the Rapid API keys that will be used (on the Headers tab) and is important for accurately reporting which user or team made the query.
If your user or team has multiple apps, select the correct app in the Apps dropdown.
If you are an Enterprise Hub user and you have configured API Gateways, select the gateway in the Request URL. Otherwise, select rapidapi.com, and the Rapid Runtime will be used when testing the API.
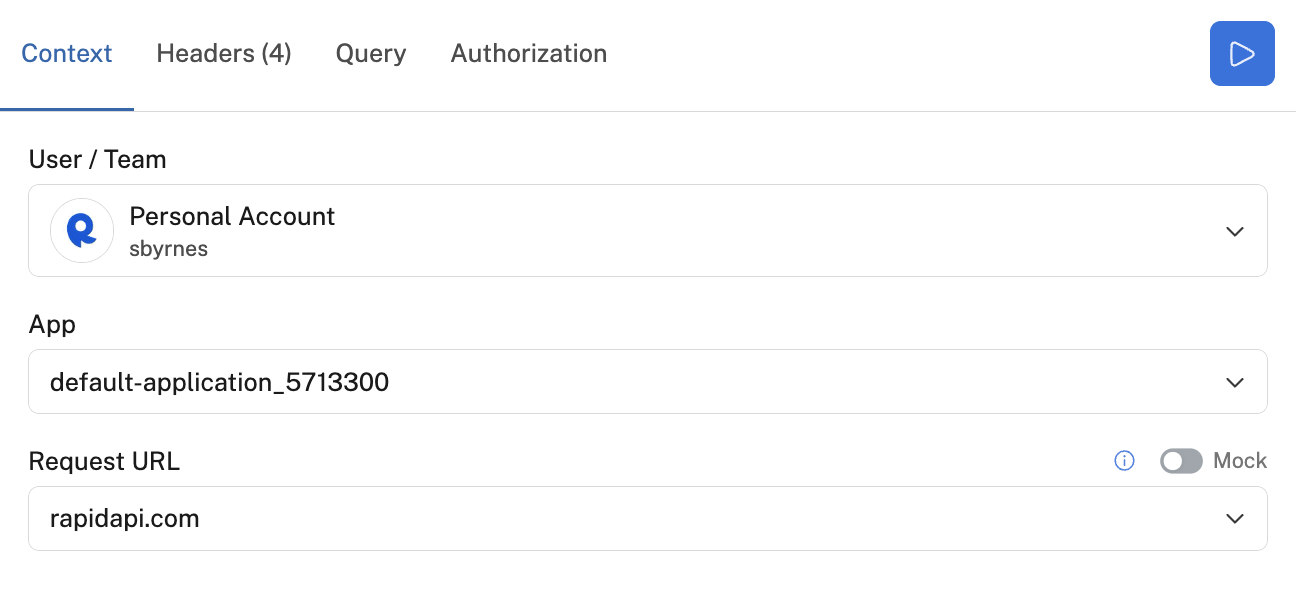
The Context tab in the middle frame.
Center frame - Headers tab
The Headers tab is where you can set required and optional request headers for the API. In some case, these values will be filled in for you. For example, in the screenshot below, the Authorization headers is populated with a Base64 value resulting from entering the user and password on the Authorization tab (see the Authorization tab below).
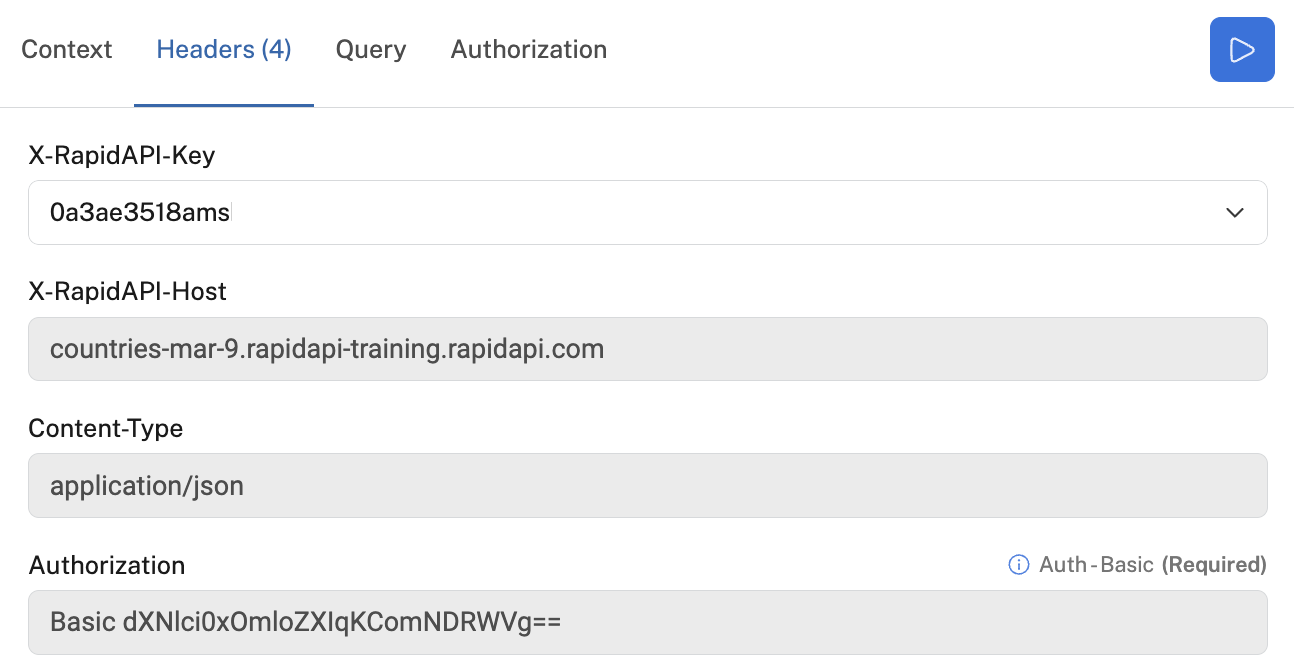
The Headers tab in the middle frame.
Center frame - Query tab
Query editor
The top area Query tab displays the query editor. This is a text are that displays the query or mutation that will be executed if you click the execution icon (explained below). It also contains the text that will be included in any Code Snippets in the right frame.
There are three main ways to populate the text of the query editor
- Paste an existing query. For example, from a tutorial. This query can be modified using either of the approaches below.
- Build or modify a query graphically using the Explorer mode in the left frame.
- Type the query or mutation manually, taking advantage of the intelligent graphQL editor. You can type Ctrl-Space or just start typing to take advantage of auto complete.
The Query tab has three action icons on the right:
- Prettify query
- Merge fragments into query
- Copy query
Variables tab
If your query or mutation uses variables, click the Variables tab and enter the JSON object. In the example below, the id value is passed in as a variable.
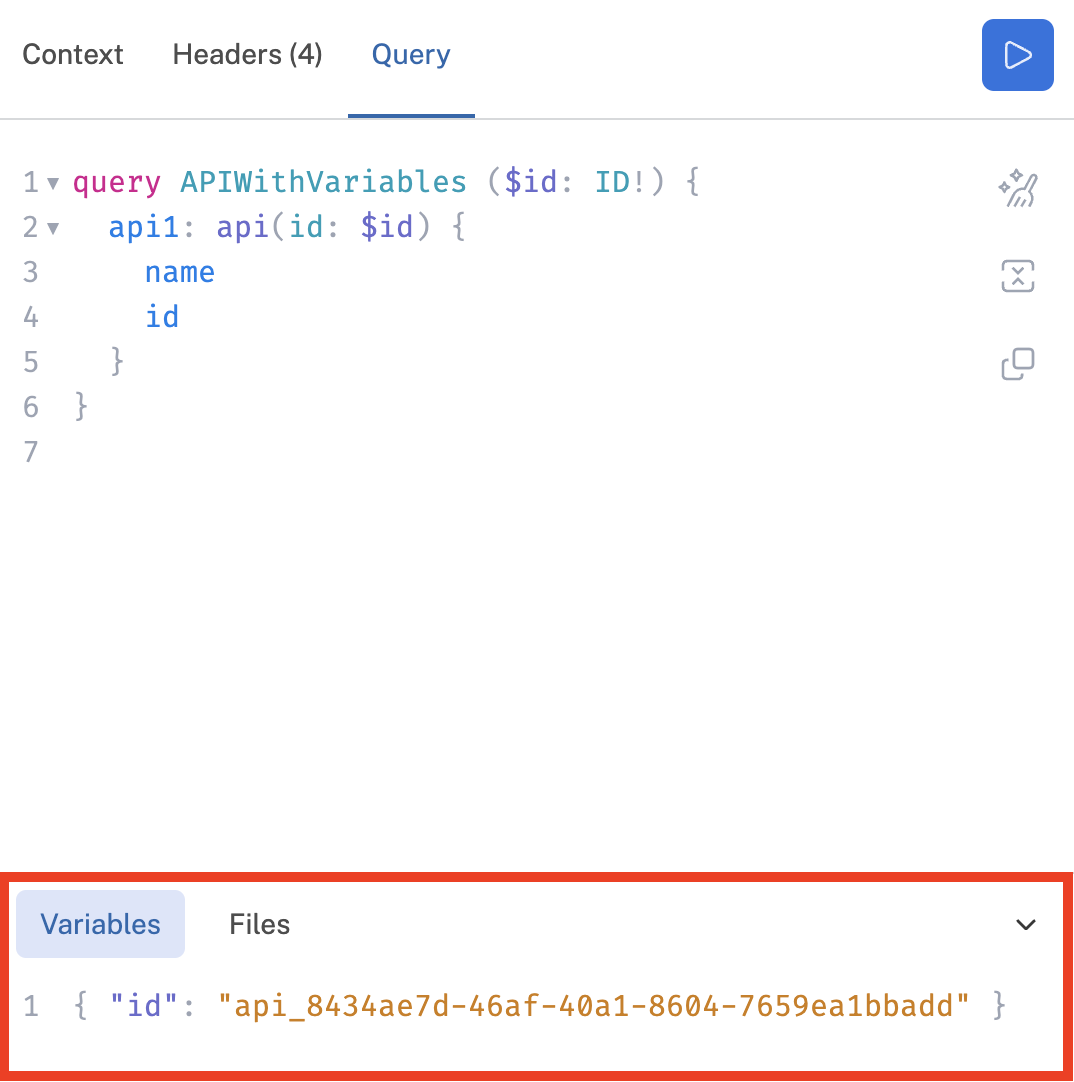
Specifying Variables for a query.
Files tab
The Files tab is used if you are calling a mutation that includes a file upload. Click the Files tab, then the plus sign to browse to a local file. In the path to variable textbox (the top highlighted box in the screenshot below), specify the path to the location of the file as defined in the Variables. In the screenshot below, the mutation expects the file to be located in the spec field of theupdates object (updates.spec).
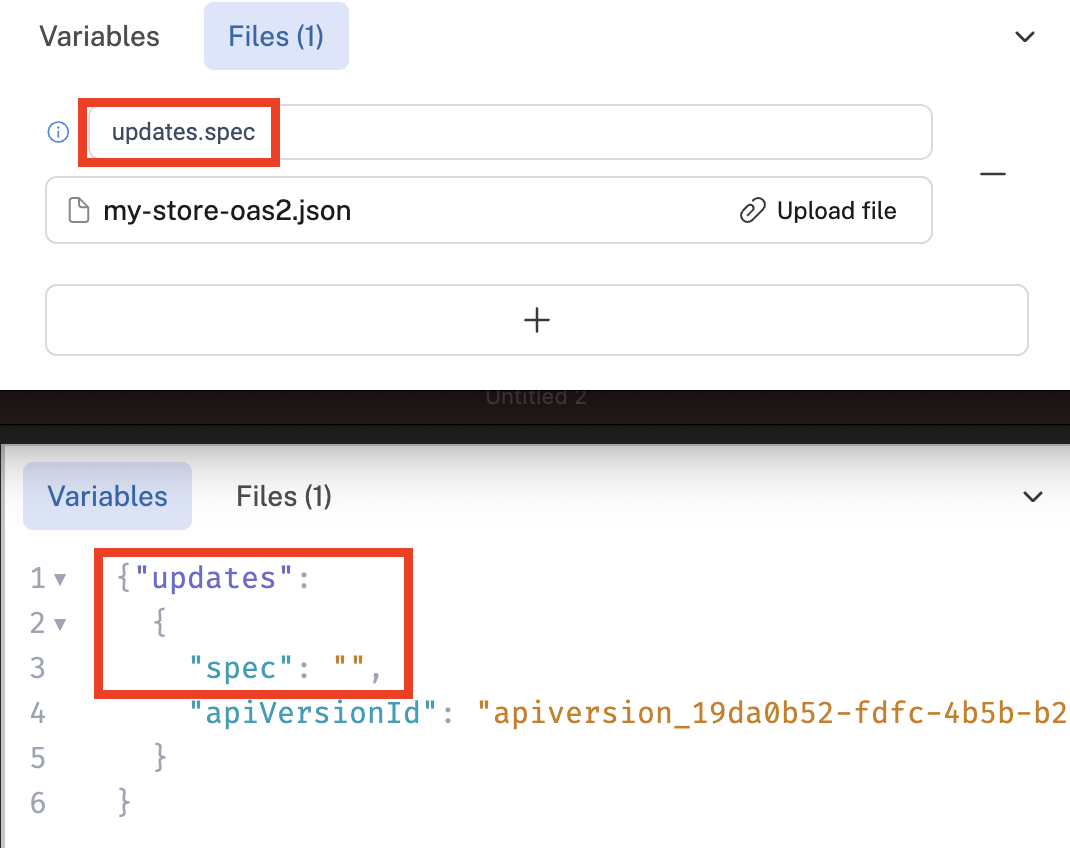
When uploading a file, specify the "path to variable" (top screenshot). This corresponds to the path to the file in the Variables tab (bottom screenshot.
Center frame - Authorization tab
The Authorization tab is only visible if your API uses authorization (security schemes) in addition to the Rapid authorization.
In the example below, we have set up HTTP Basic authentication on our API.
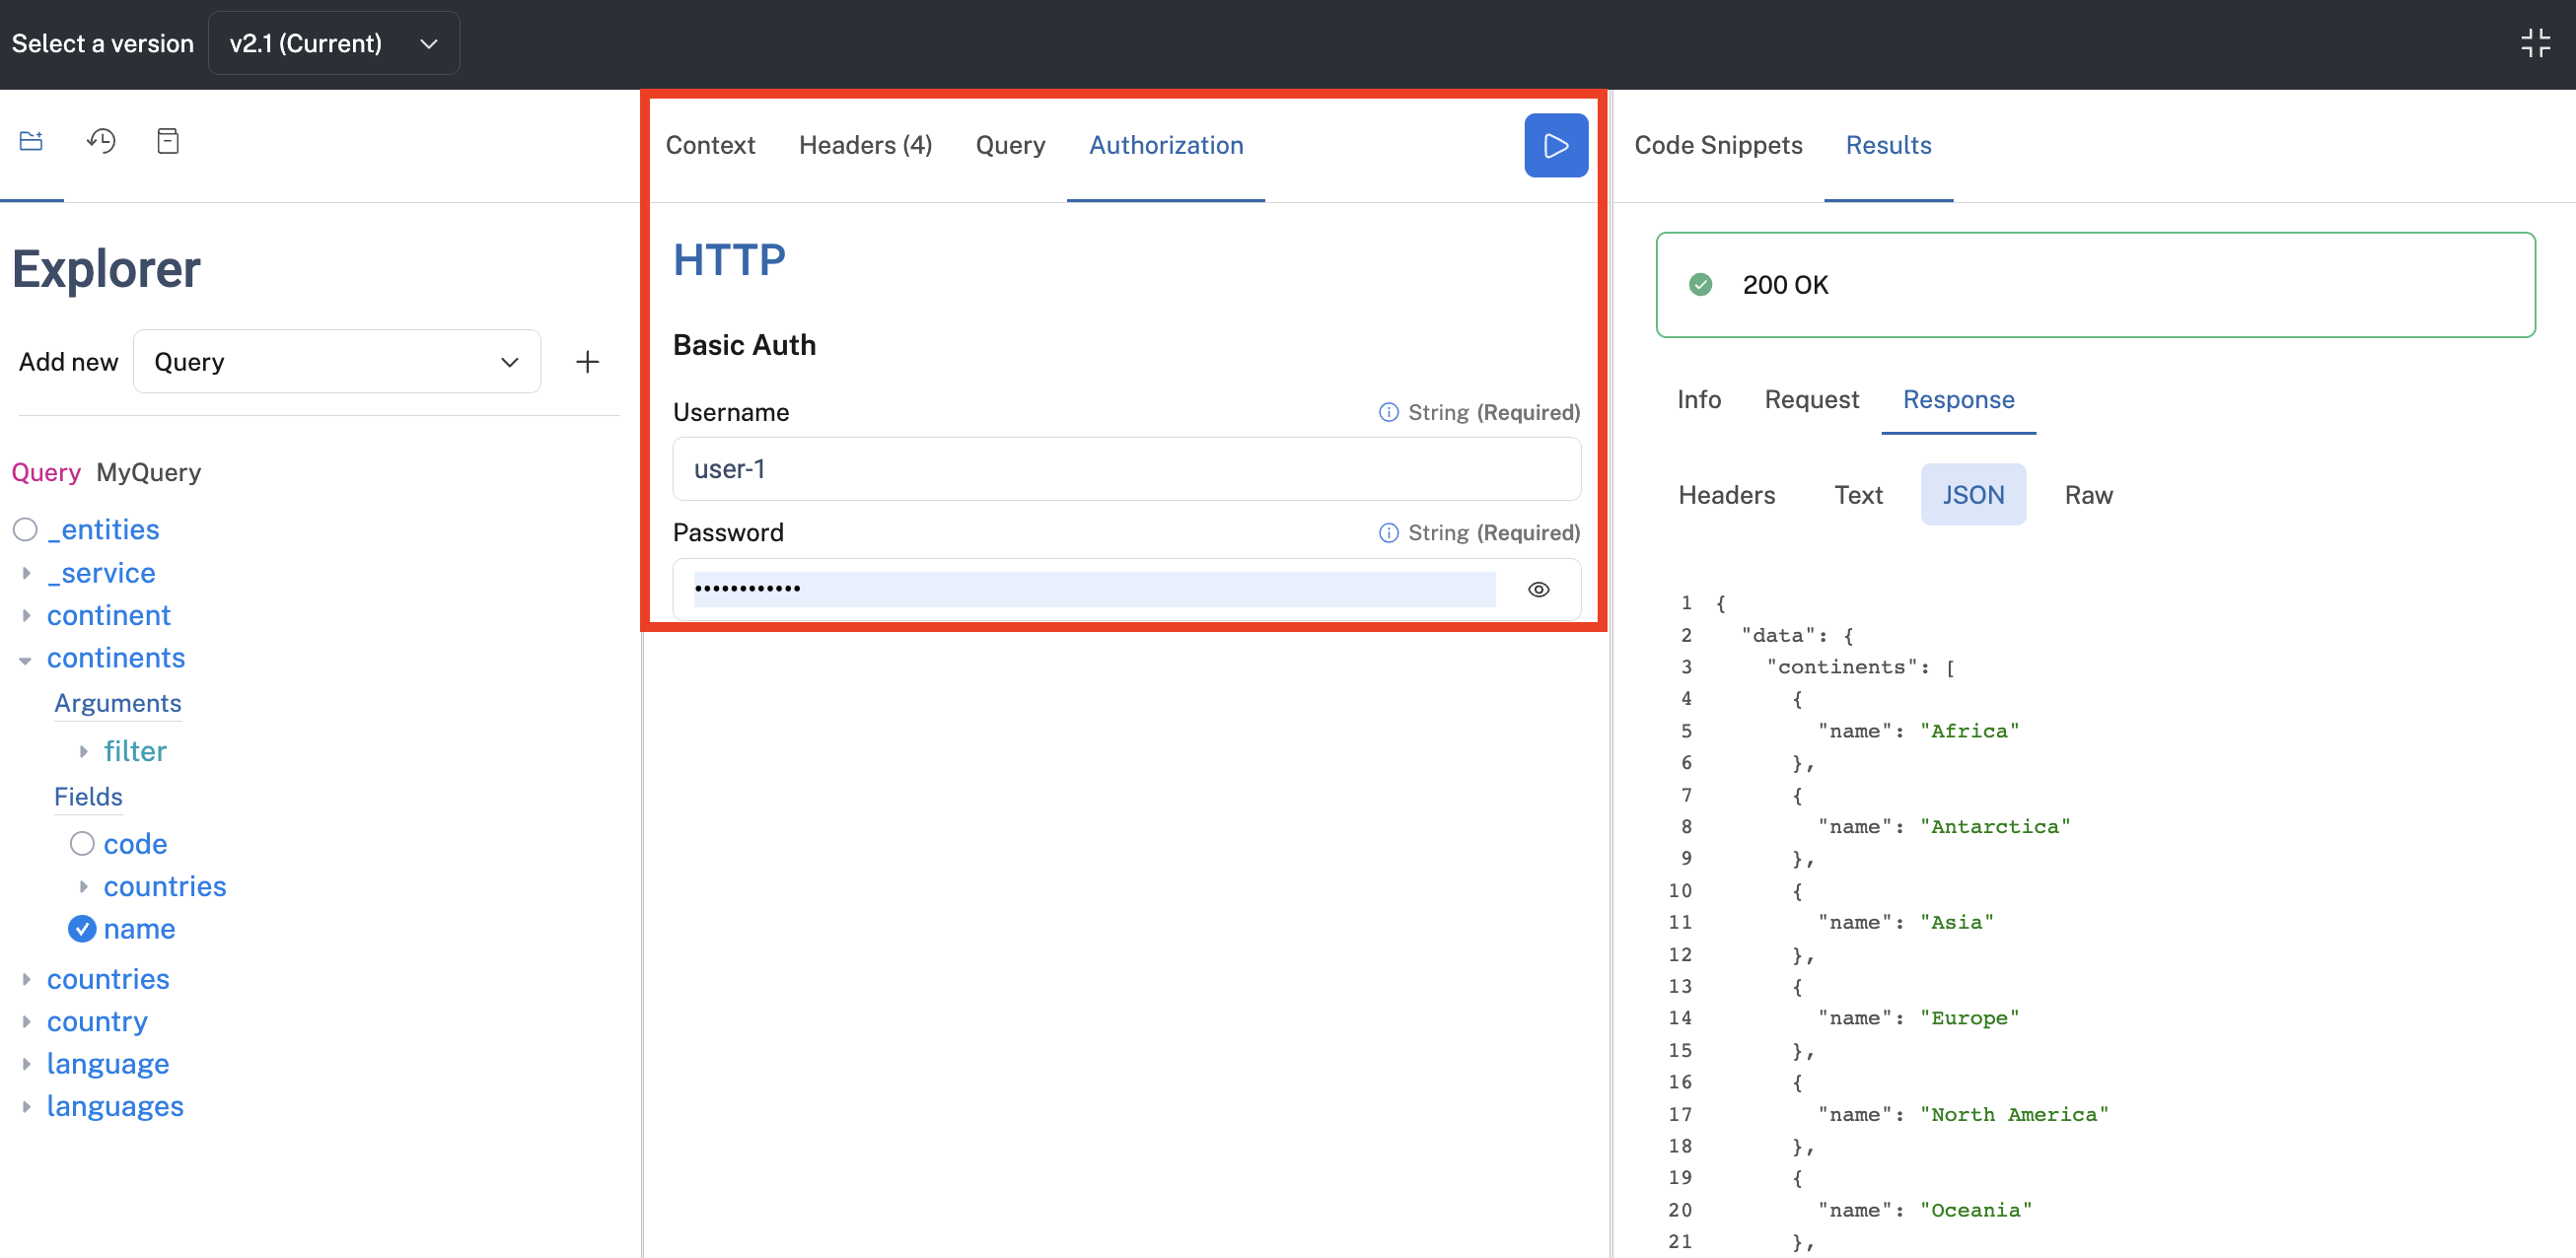
This API has HTTP Basic authentication configured.
Center frame - Execution icon
The icon in the upper right is used to execute the query. The icon is a right-facing triangle (see screenshot below) if you have subscribed to a plan for the API. Clicking this icon executes the query.
Keyboard shortcutYou can press Ctrl-Enter to execute the query or mutation.
The execution icon if you have subscribed to the API
If you have not subscribed to a plan for the API, the icon looks like the icon in the screenshot below.
The execution icon if you need to subscribe to the API before executing a query.
Clicking this icon will take you to the Pricing tab, where you can subscribe to a plan.
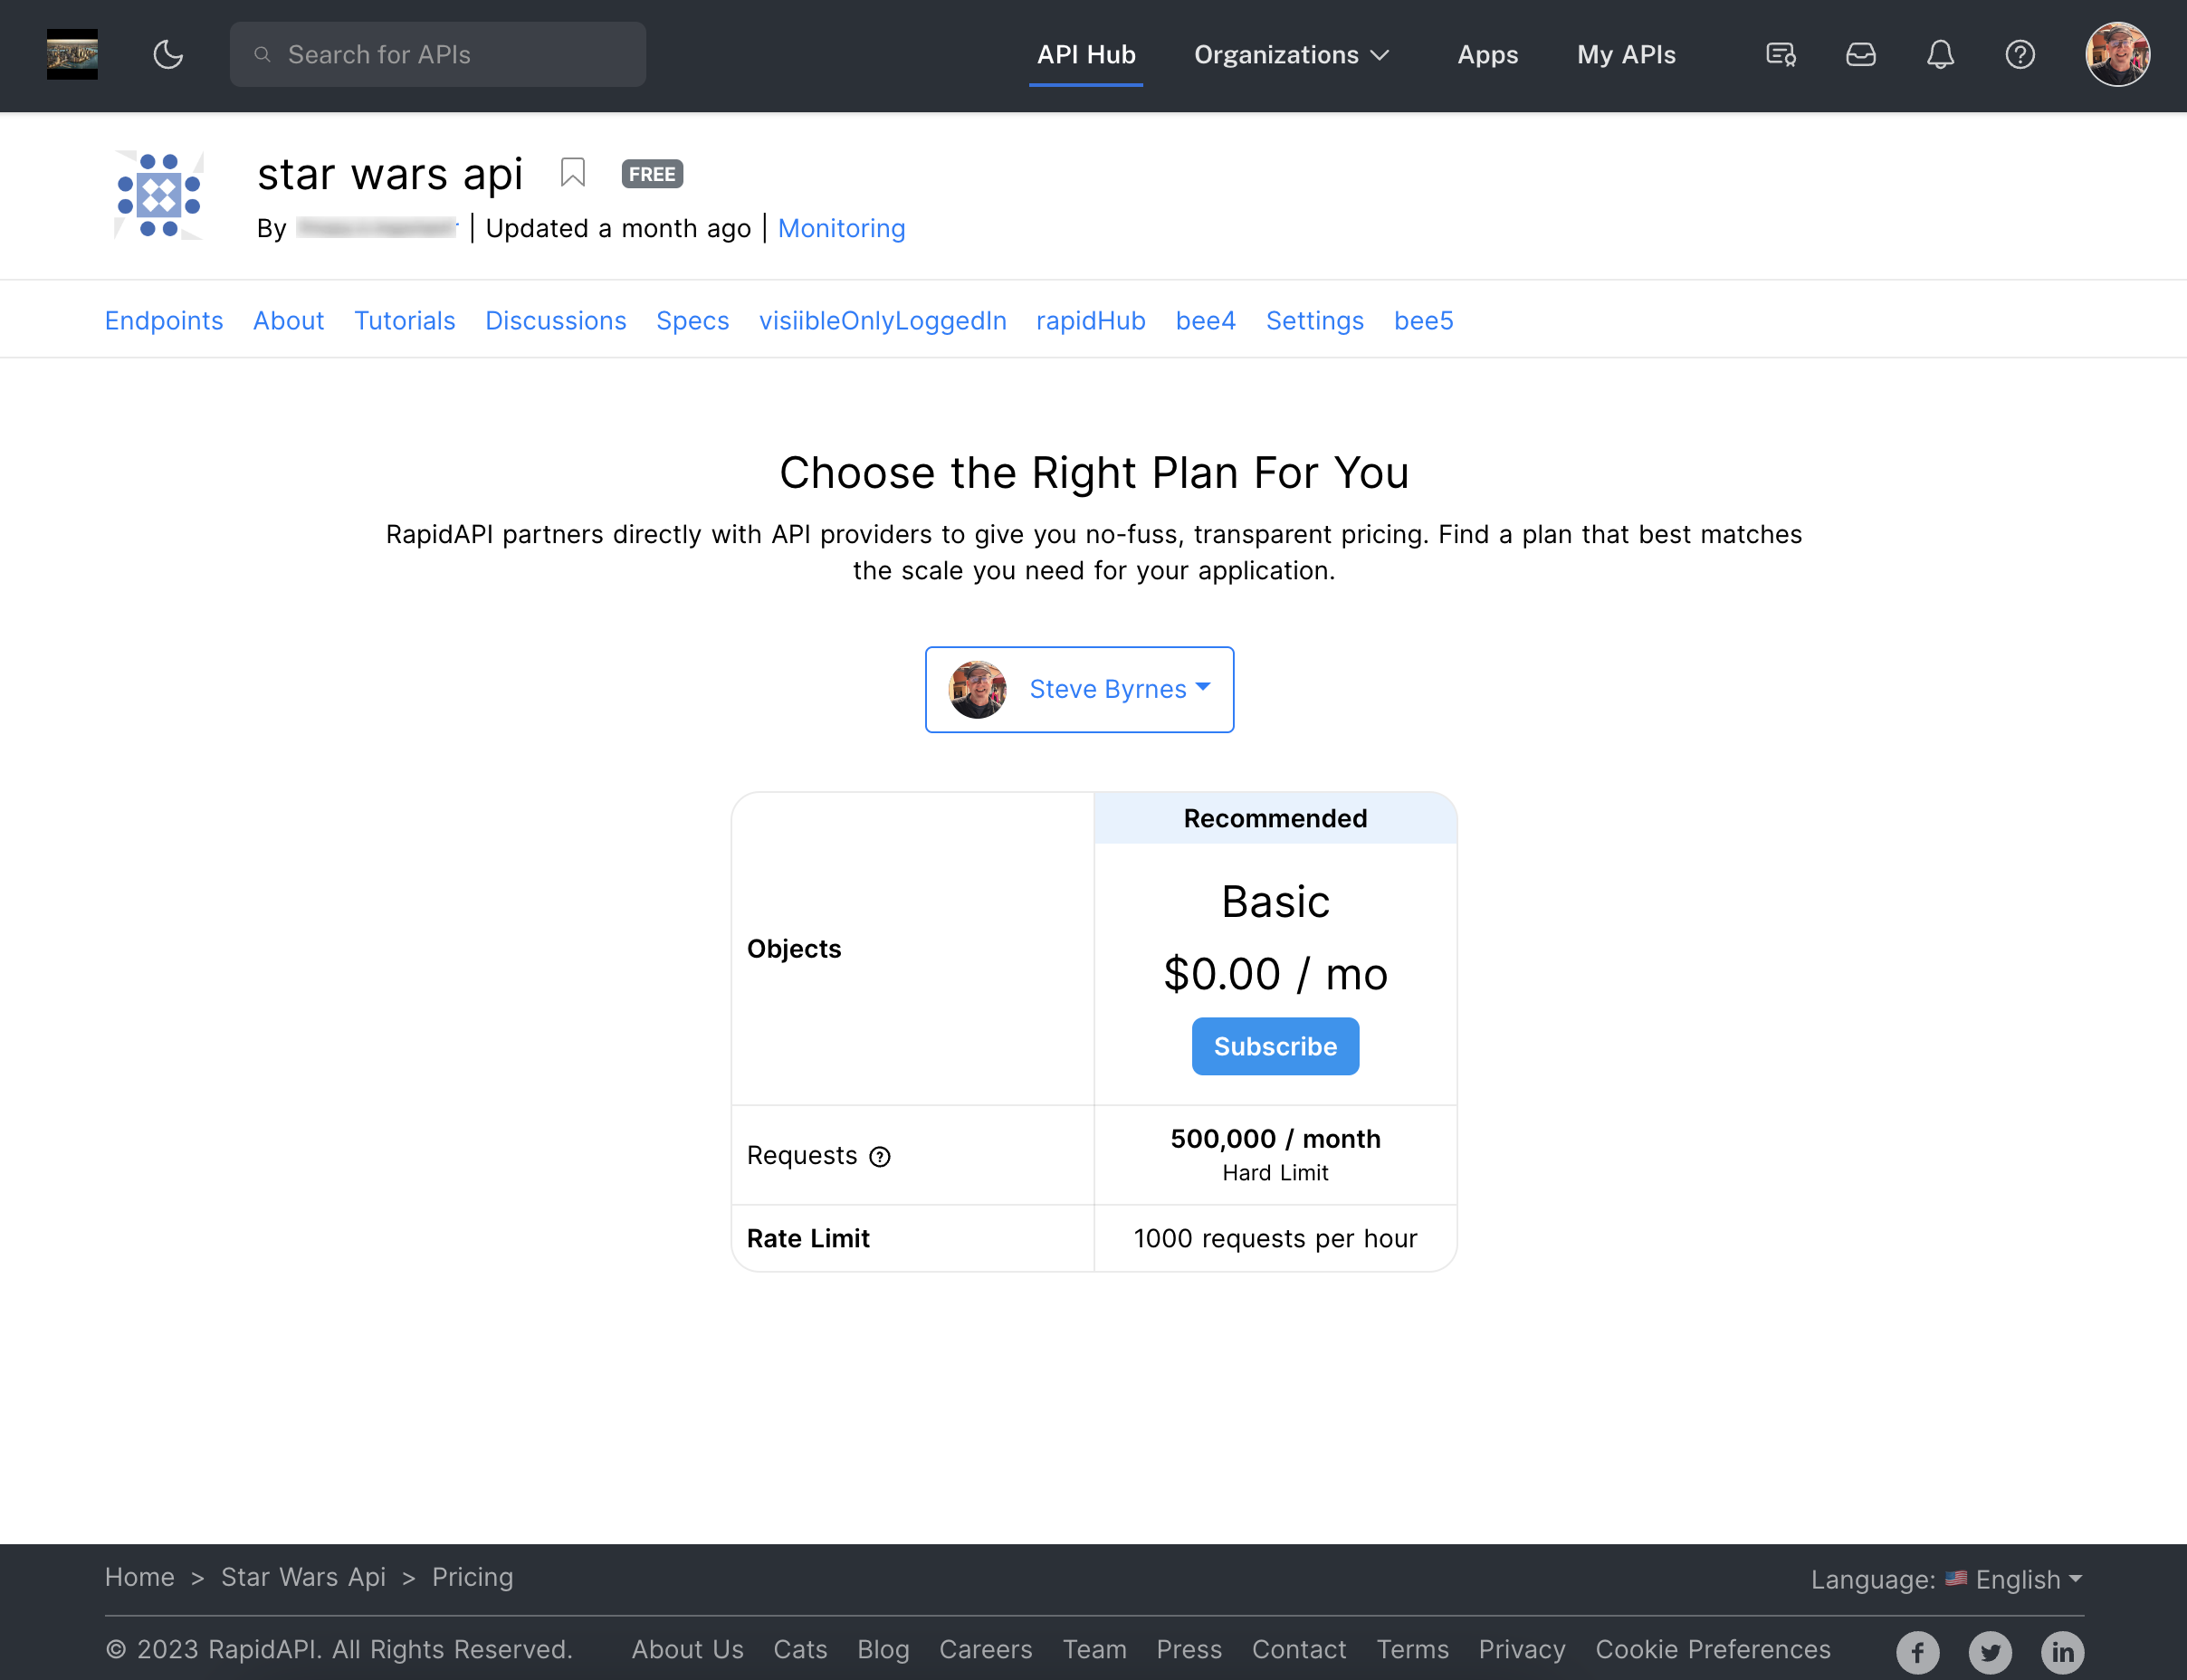
You may be brought to the Pricing tab if you have not subscribed to the API.
After subscribing to a plan for the API, you can navigate back to the Endpoints tab and execute the query.
Right frame
The right frame has three tabs:
Right frame - Code Snippets tab
When you have configured your query, you can view the corresponding code in the programming language of your choice using the Code Snippets tab. Code snippets are useful for getting the query working properly in your application.
Select your language of choice in the Target dropdown. Select your library of choice in the Client dropdown. Click the copy icon on the right to copy the code to your clipboard.
The values you select for Target and Client will be saved and used the next time you execute a query.
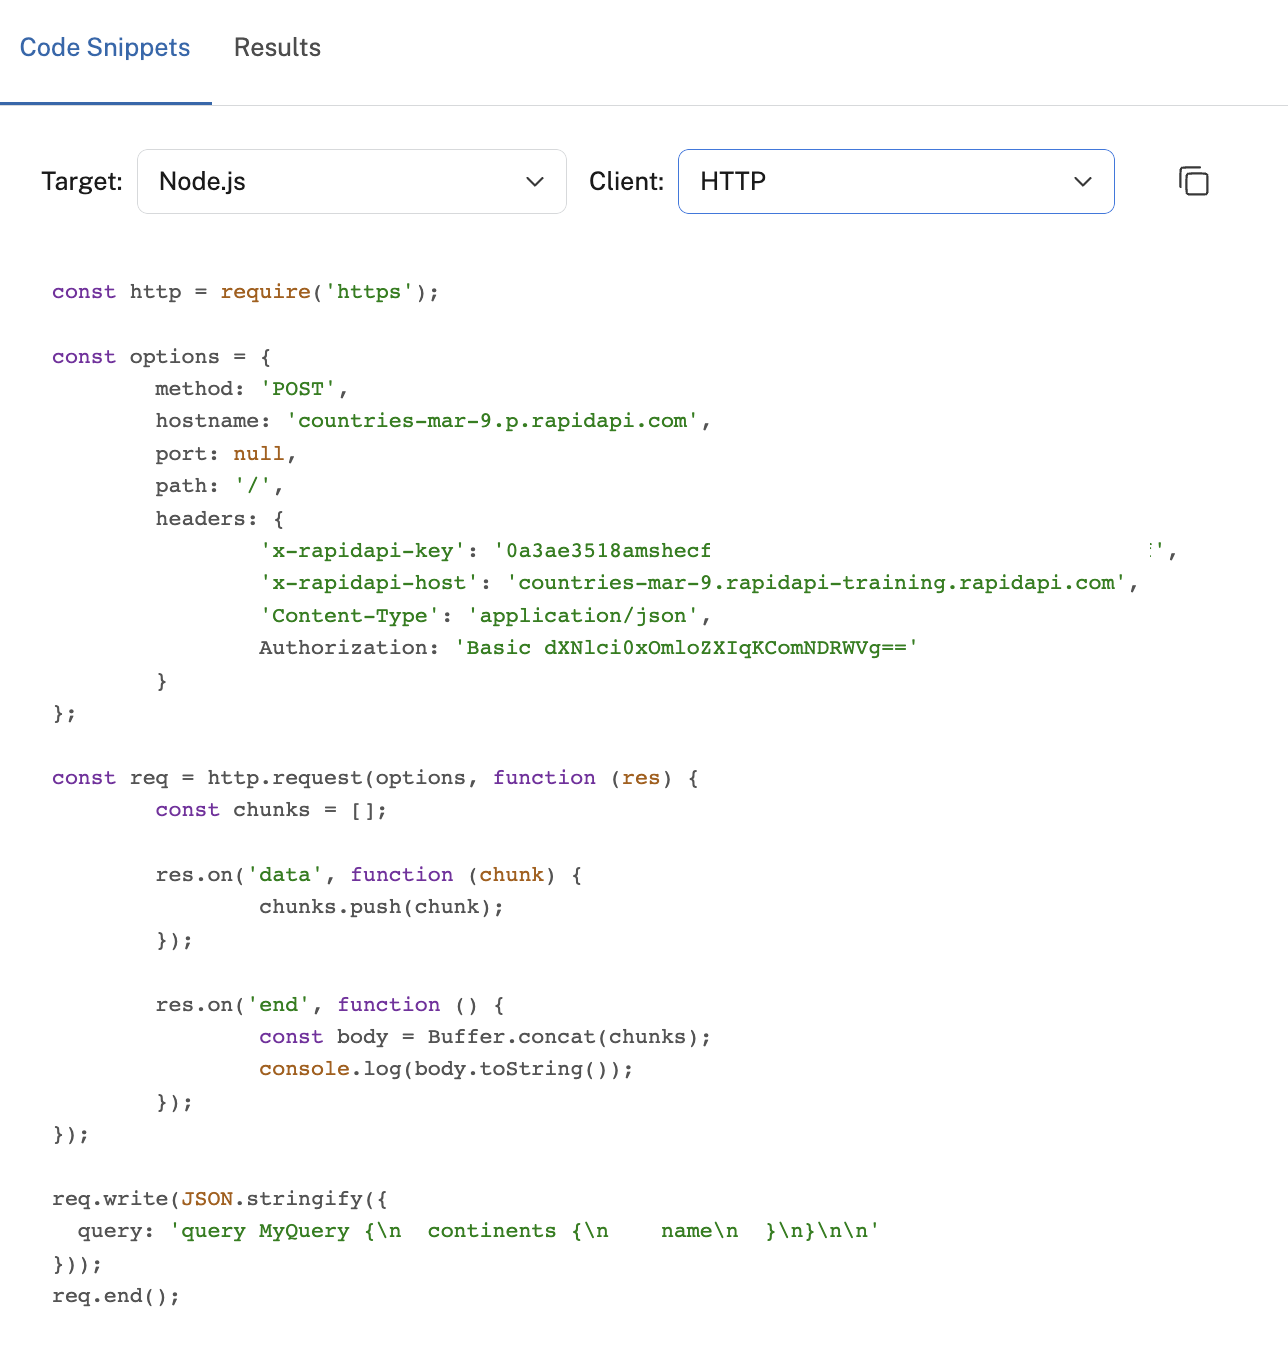
The Code Snippets tab in the right frame.
Right frame - Example Responses tab
If the API builder has configured example responses for the endpoint, you will see an Example Responses tab, allowing you to view details similar to expected responses. This is useful if you have not yet executed the query to help understand what is expected.
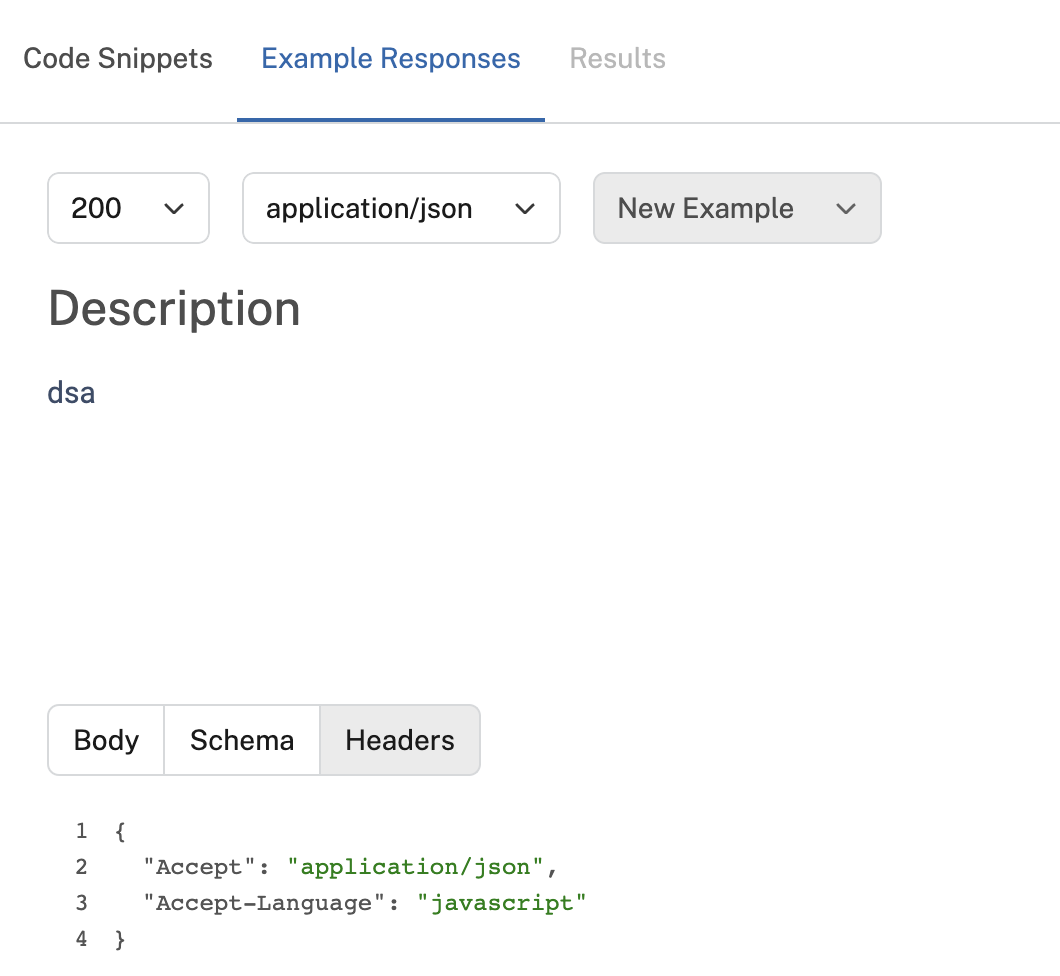
The Example Responses tab.
Right frame - Results tab
The Results tab includes the HTTP status of the query (in the screenshot below, it is 200 OK as well as three sub-tabs.
The Info sub-tab displays basic information about the request, as shown below.
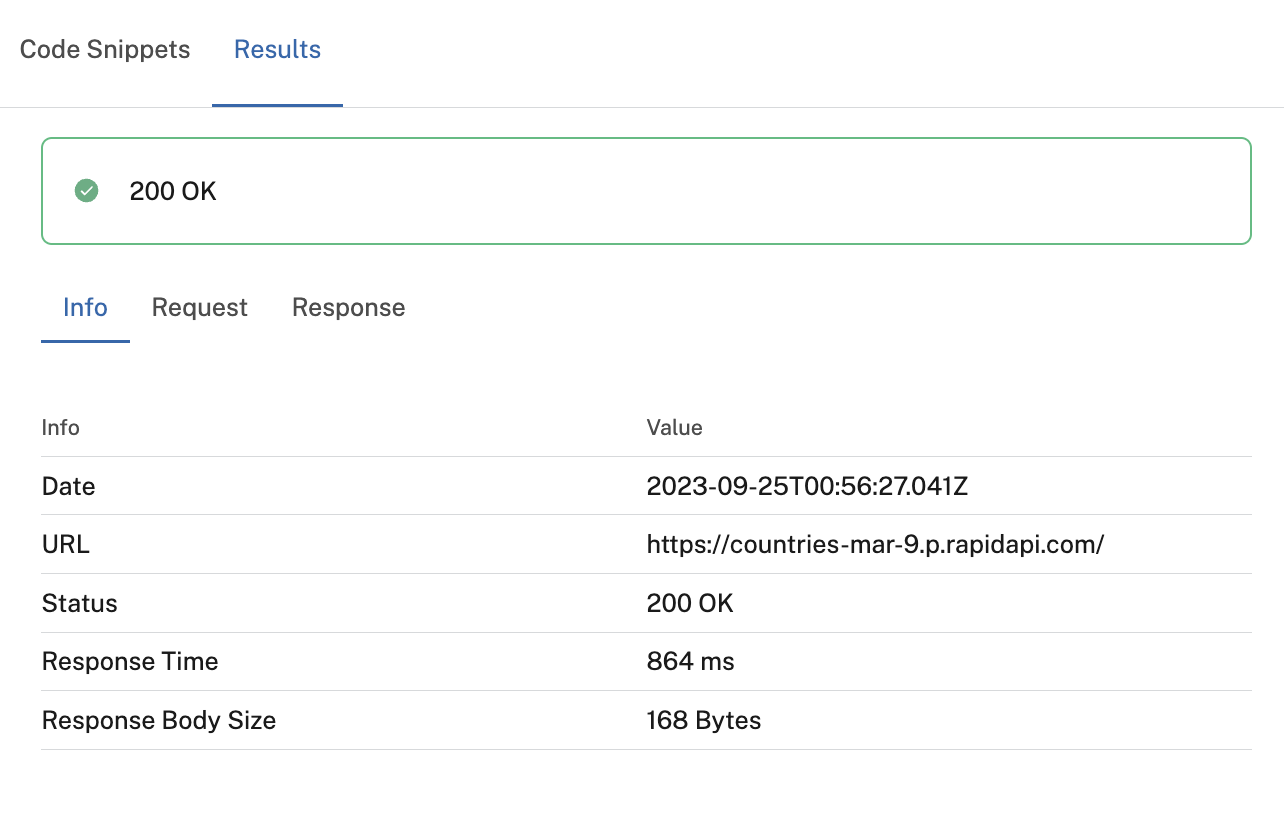
The Info tab under the Results tab.
The Request sub-tab shows details of the request. You can click on the Headers tab to view the request headers. Click Text to view the body of the request as text. Click JSON to view the body of the request as JSON. Click Raw to view the full text-based HTTP request (as shown in the screenshot below).
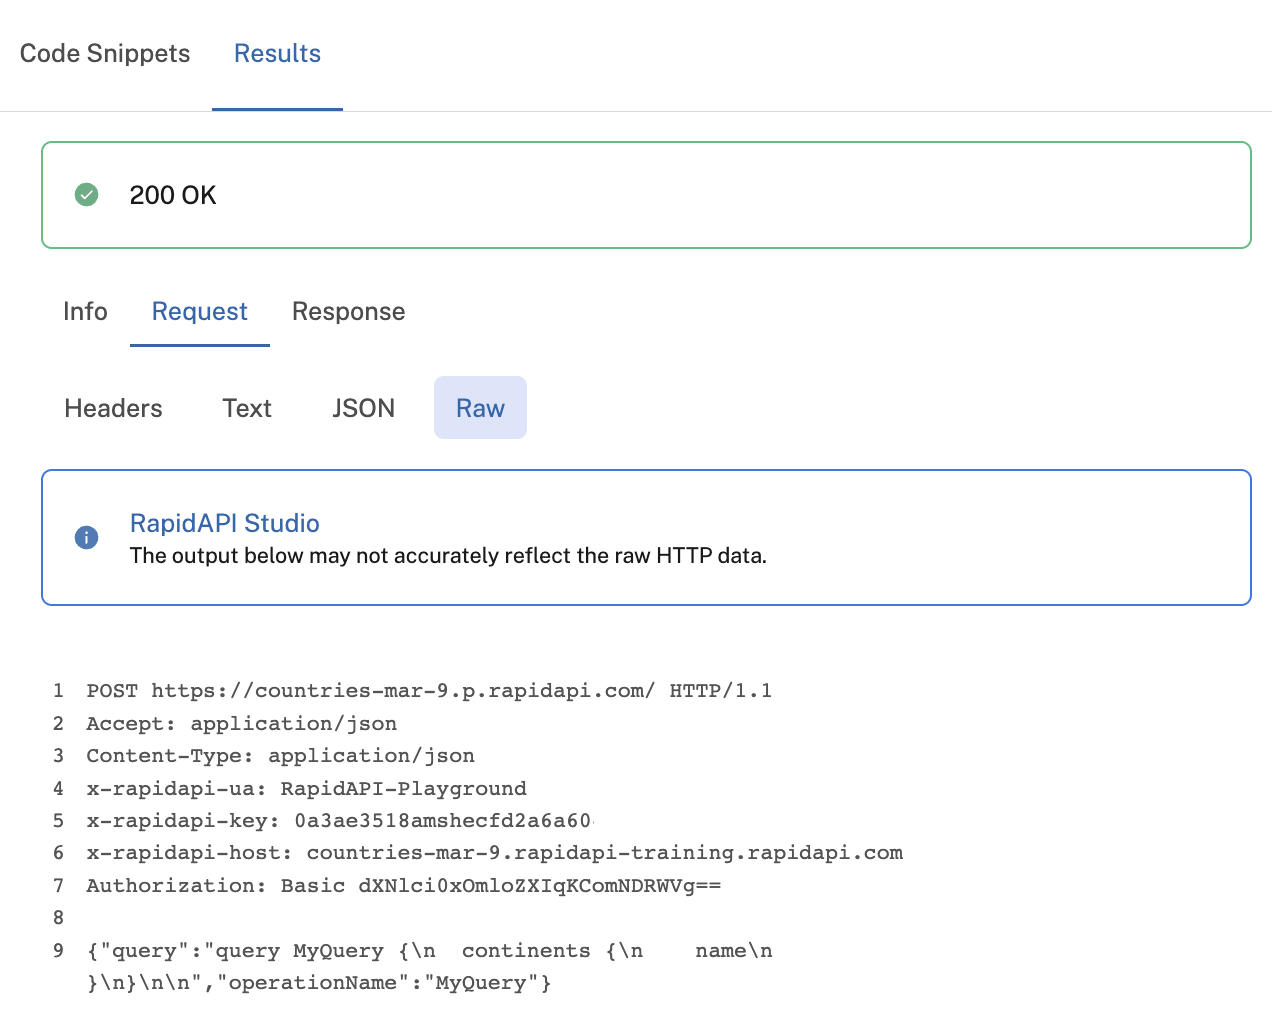
The Request tab under the Results tab.
The Response sub-tab shows details of the response. Click the Headers tab to see the response headers. Click the Text tab to see the response body as text. Click the JSON tab to see the response body as JSON (this will be the default tab if the response is JSON, otherwise the default tab is the Text tab). Click the Raw tab to view the full text-based HTTP response.
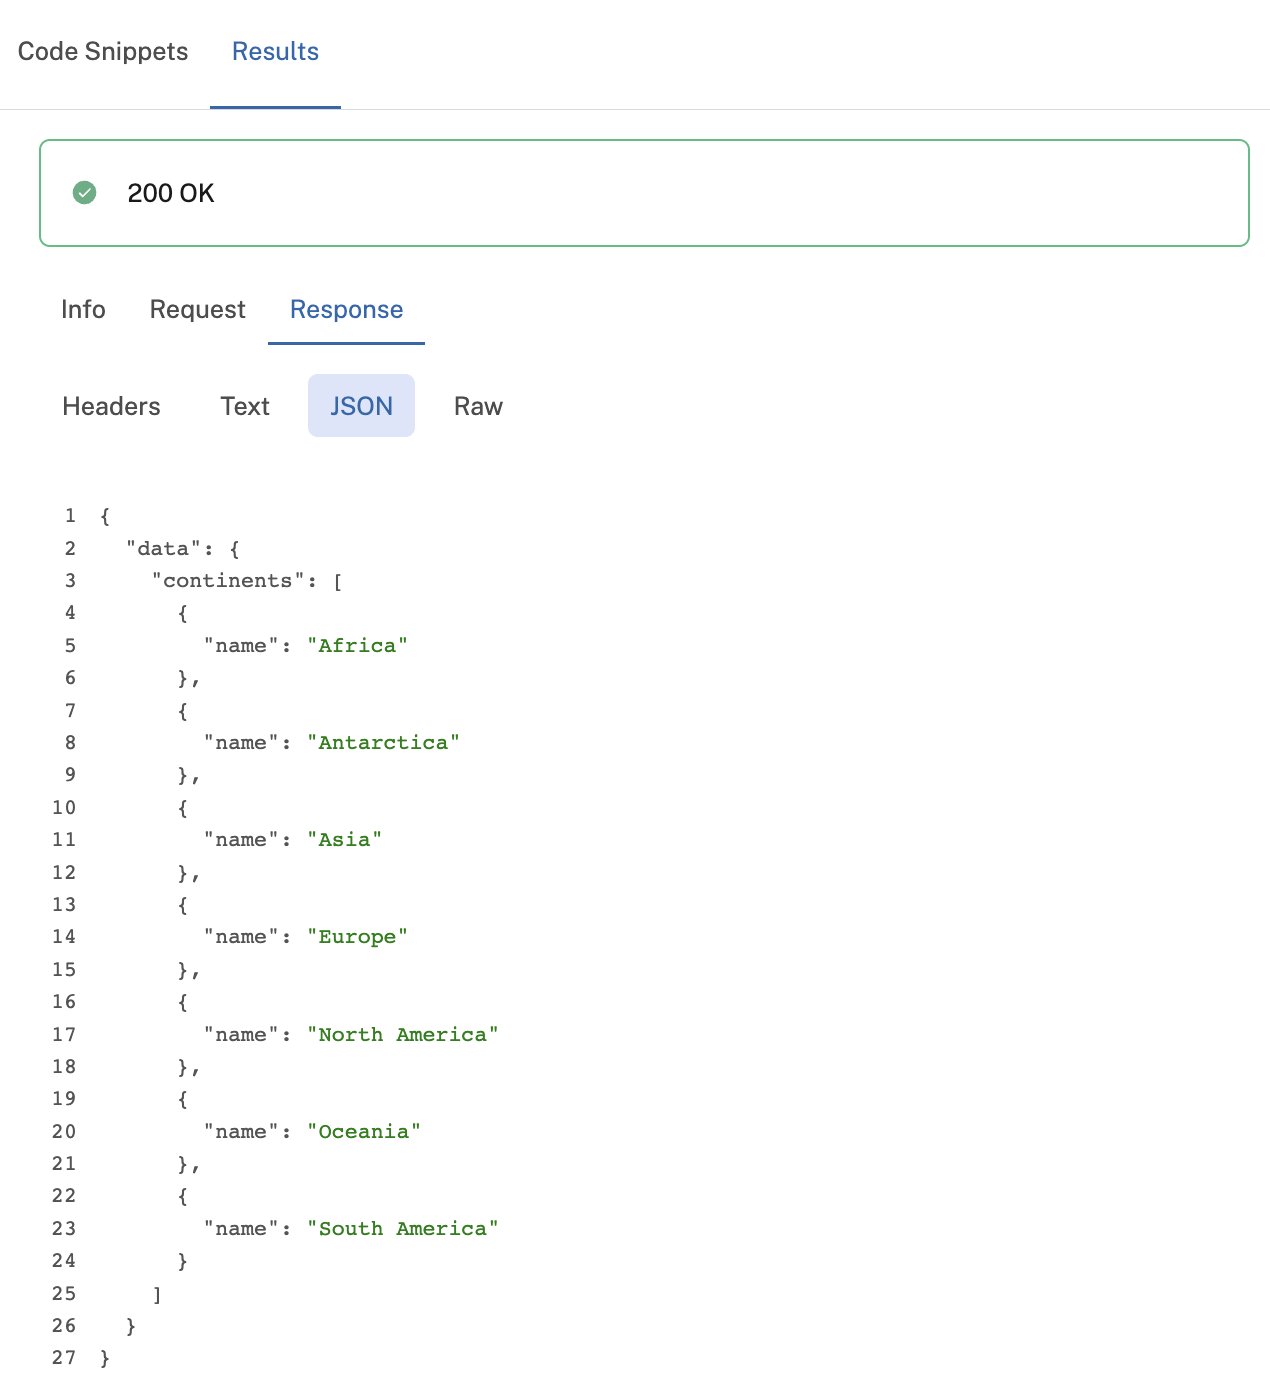
The Response tab under the Results tab.
Updated about 1 year ago