Platform Analytics API
Populate Studio (My APIs) and the Developer Dashboard (Apps) analytics for APIs that don't use the Rapid Runtime.
When an enterprise chooses to not use the Rapid Runtime for an API, one drawback is that they lose the runtime usage analytics in Studio and the Developer Dashboard. However, an enterprise can populate analytics for this API by sending usage data to Rapid asynchronously, as described in this document.
Platform Analytics API vs. Platform APIThe Platform Analytics API is a new API that currently contains one main endpoint, /calls, as described in this document. This API is different from the Platform API.
Gateway integrationsAs a more convenient way to send logs asynchronously to Rapid, you can use an Analytics Gateway Integration instead of the Platform Analytics API.
Azure integrationsFor details on how to configure the Platform Analytics API with Azure gateways, see Azure API Management Analytics Integration.
Background
If requests to an API's endpoints are sent via the Rapid Runtime, associated analytics information is automatically populated in Rapid Studio and the Developer Dashboard. If requests to an API's endpoints do not use the Rapid Runtime, Rapid is "out of the runtime" and by default analytics information is not available in Rapid Studio and the Developer Dashboard. If you want to display analytics in both of these, you can send the logs as described in this document.
If you are using the Rapid Runtime for requests to your API, this document does not apply to you and you can stop here.
Overview of the process
- Identify and configure one or more APIs in your Enterprise Hub to not use the Rapid Runtime.
- Call the Platform Analytics API's /calls endpoint to send analytics data to Rapid.
- View the analytics in the Developer Dashboard (API consumer perspective) and/or Studio (API builder perspective).
Details on this process are described below.
1. Identify and configure an API to not use the Rapid Runtime
See API Gateways for information on how to configure an API to not use the Rapid Runtime in runtime requests. Once you have finished configuring your API, make a note of its API ID to use when calling the Platform Analytics API in step 2.
2. Send data to the /calls endpoint
In this step, you send data to the /calls Platform Analytics API endpoint. The data submitted to this endpoint is a strongly-typed (schema-bound) set of fields that map to the Rapid analytics data model. Once this data is sent to Rapid, it can be displayed in Studio and optionally in the Developer Dashboard.
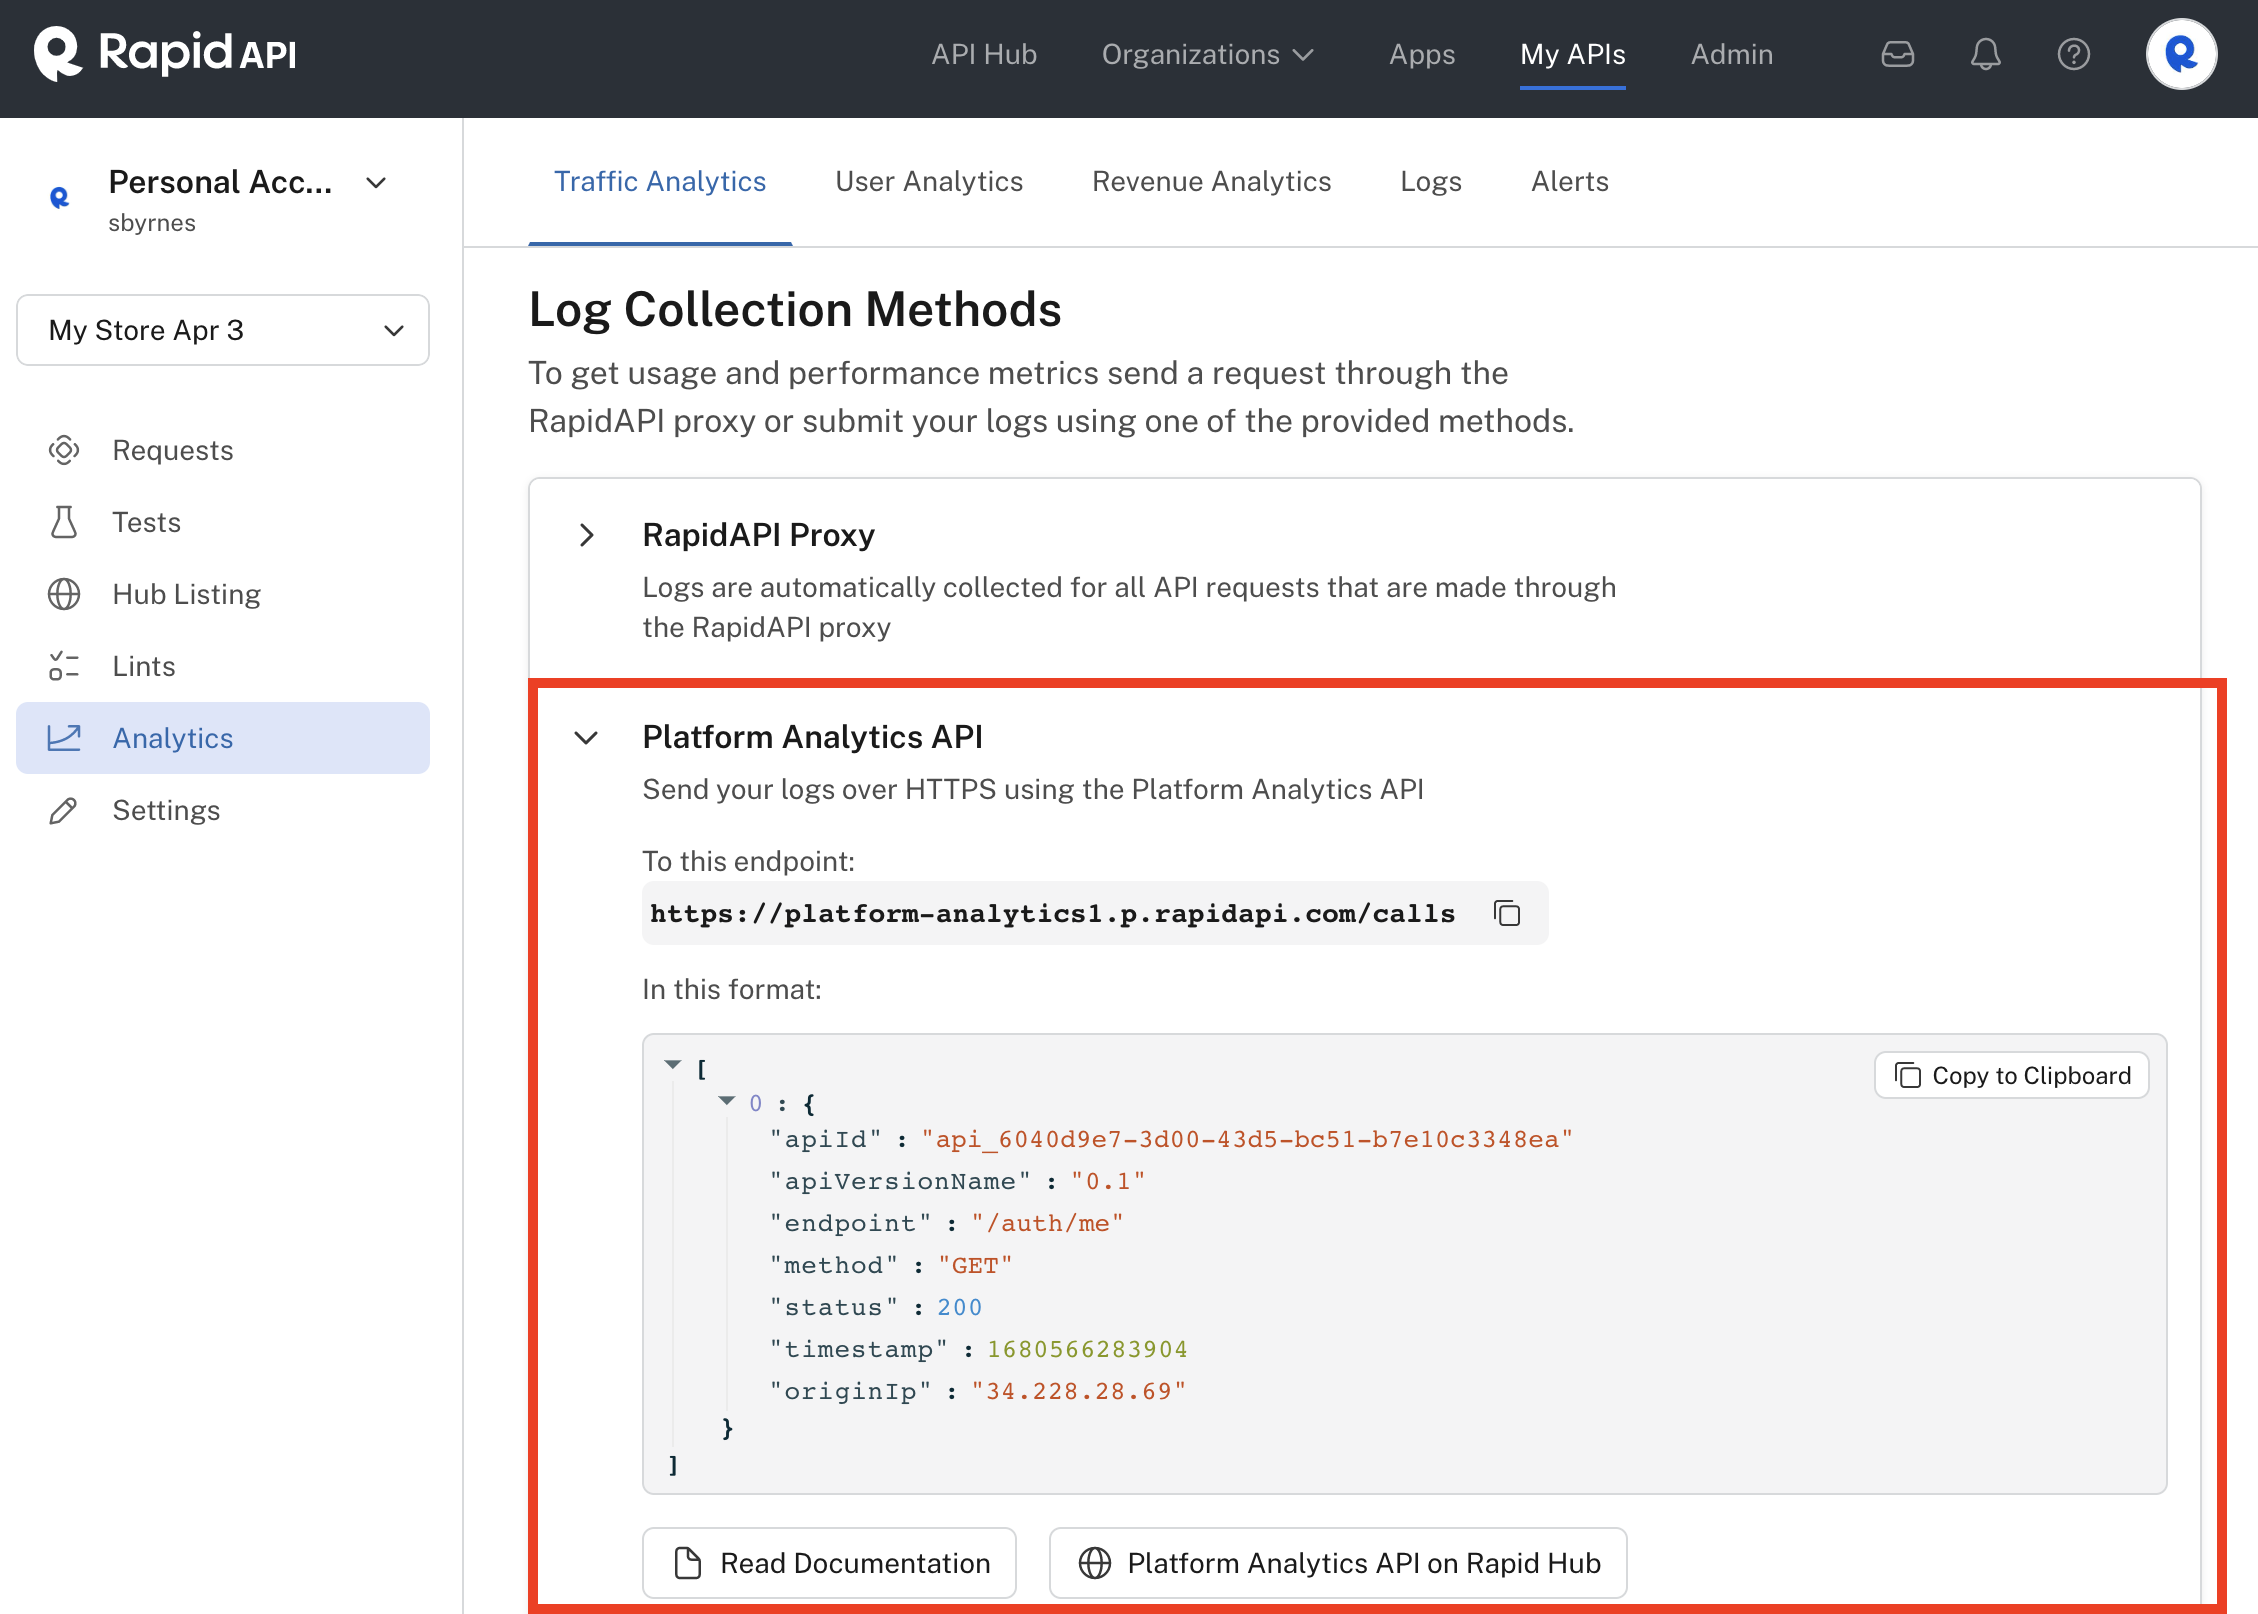
Any easy way to get started with the Platform Analytics API is to click the Analytics tab for your API Project in Studio (My APIs), as shown in the screenshot below. Expand the Platform Analytics API dropdown. You will see a convenient link to the /calls endpoint, an example body of a request to this endpoint (with context-sensitive values), a link to the Platform Analytics API documentation, and a link to the Platform Analytics API listing on your Rapid Hub.

Using the Platform Analytics API help to get started.
You send data in the body of a POST request to the /calls endpoint. The body must contain a JSON array with up to 100 objects. Each object represents an entry for a call to one of your API's endpoints. The table below describes details of each field in the objects sent to the /calls endpoint. This identifies the "schema" related to the analytics objects sent to Rapid.
Mandatory attributes
| Field Name | Field Type | Example | Description |
|---|---|---|---|
| apiId | string | "api_cae9fbce-18de-48a5-be8b-8a1427b04xx" | The API ID for which you want to send analytics. The ID is part of the URL of the API listing in Studio. Alternatively, you can use the Platform API to obtain API IDs. |
| endpoint | string | "/customer" | The API endpoint called by the consumer. This value is relative to the base URL. |
| method | string | "POST", "PUT", "GET" | The HTTP method used when calling the API endpoint. |
| status | integer | 200, 400 | The HTTP response status code returned when the consumer calls the API endpoint. |
| timestamp | integer | 1647428905000 | The timestamp of the call to the API endpoint. The timestamp is specified in Unix epoch time. The timestamp must be within 24 hours of the current time. The current timestamp can be obtained at www.unixtimestamp.com. |
Obtaining the information above using the GraphQL Platform APIYou can use the GraphQL Platform API to programmatically obtain most of the information in the table above.
Anonymous consumer logsIf you send only the mandatory attributes above, only Studio (My APIs) analytics will be available. These are known as "anonymous" logs. If you would also like analytics to show for a user or a team in the Developer Dashboard (Apps), you must also send the application (appId) described under Optional Attributes below.
Sending analytics data using the API Hub
Use the following steps to upload external API analytics "manually" from the API Hub. This is useful for getting started or testing this process.
- Inside Studio, navigate to the API listing for which you would like to upload analytics.
- Note the following mandatory information from the UI (or use the Platform API to find it programmatically):
- apiId - can be found in the page URL
- endpoint - any endpoint from your schema found under "Hub Listing > Endpoints"
- method - the method of the endpoint you chose
- status - the HTTP status of the response
- timestamp - you can use the current timestamp from here: www.unixtimestamp.com
- In the API Hub, search for "Platform Analytics". Click on the Platform Analytics API, expand the calls group and select the POST Upload Analytics operation.
- In the dropdown in Request Body section (below the Header Parameters in the center frame), add the following JSON and modify the field values to match your data.
[
  {
    "apiId": "{selected API id}",
    "endpoint": "{selected endpoint path}",
    "method": "{selected endpoint method}",
    "status": 200,
    "timestamp": {current unix timestamp}
  }
]- Click Test Endpoint. An HTTP response code of 200 "Success" indicates that the analytics have been uploaded successfully.
The Platform Analytics API is asynchronous, and thus returns a status of 200 without validating the body content. The way to validate that the log was correctly added to an API is by going to its analytics and ensuring it is listed.
Optional attributes
There are additional optional attributes available that can be used to add additional metadata or to simplify integrations.
Field Name | Field Type | Example | Description |
|---|---|---|---|
apiBaseUrl | string | The apiBaseUrl can be used instead of the "apiId". If the value matches the apiBaseUrl defined on an API listing on Rapid, the log would be assigned to that API. In general, the apiBaseUrl should contain everything but the endpoint (scheme + host:port + path that is not the endpoint). This approach has two limitations to be aware of:
| |
appId | string | "3030487" | The app which made the API call. The app ID can be found in the Developer Dashboard (My Apps) when expanding an app listing (right under the name), or obtained through the Platform API. If not specified, the consumer will be resolved to "Anonymous". |
apiVersionName | string | "1.0.1" | The name of the version of the API that the API consumer called. If not specified or the version name does not match, the "current" API version is used. The version name can be obtained for the API in Studio using the Hub Listing > Endpoints tab or by using the GraphQL Platform API. |
apiLatency | int | 122 | The latency of the API call from the time it was sent to the time a response was returned. Not adding any latency will default it to 0. |
originIp | string | "192.158.1.38" | The IP address of the API consumer. If not set, the IP address of the caller of the Platform Analytics API will be used. |
Alternative field values
For the API and app, instead of using the API ID, you can specify the name and owner of the API.
Field Name | Field Type | Example | Description |
|---|---|---|---|
apiId | object | "ownerName": "575557", "slugifiedName": "my-team-api"} or {"ownerName": "jdoe", "slugifiedName": "my-personal-api"} | You can specify the apiId as an object containing the API owner's team entity ID or user name and slugified API name (lower case, replacing spaces with dashes). The ownerName and slugifiedName for team-owned APIs can be found in the URL for the API when viewing it in Studio. Alternatively, this information can be found using the Get All APIs Platform API endpoint. For personally-owned APIs, use the user name (such as jdoe) for the ownerName. |
appId | object | { or { | This can be specified as an object containing the app owner's team or user name and name of the app that acts as the API consumer. See step 2 above. The ownerName is the user name (e.g. jdoe) for apps in a personal account and the slugified team name for apps in team accounts. The slugified team name can be found using the Get All Teams Platform API endpoint. If the value of the application field is not specified, analytics information will only be available in Studio. This is known as anonymous analytics. |
Sending analytics data programmatically
Once you have successfully sent analytics data using the API Hub, you can click on Code Snippets to obtain sample code in the programming language of your choice to use as a start for your own code. The code will include a POST request to the /calls endpoint.
Alternatively, you can use a Analytics Gateway Integration to send logs.
3. View the analytics
When are analytics available?Once you have sent analytics information to Rapid, it can take up to five minutes to populate RapidStudio and the Developer Dashboard (if applicable). This is consistent with API analytics for APIs that use the Rapid Runtime.
Caching when changing your APIThe log collection flow currently has a 5-minute cache on the API model. For example, changing an endpoint name could result in calls to that new name not being processed until the cache is refreshed.
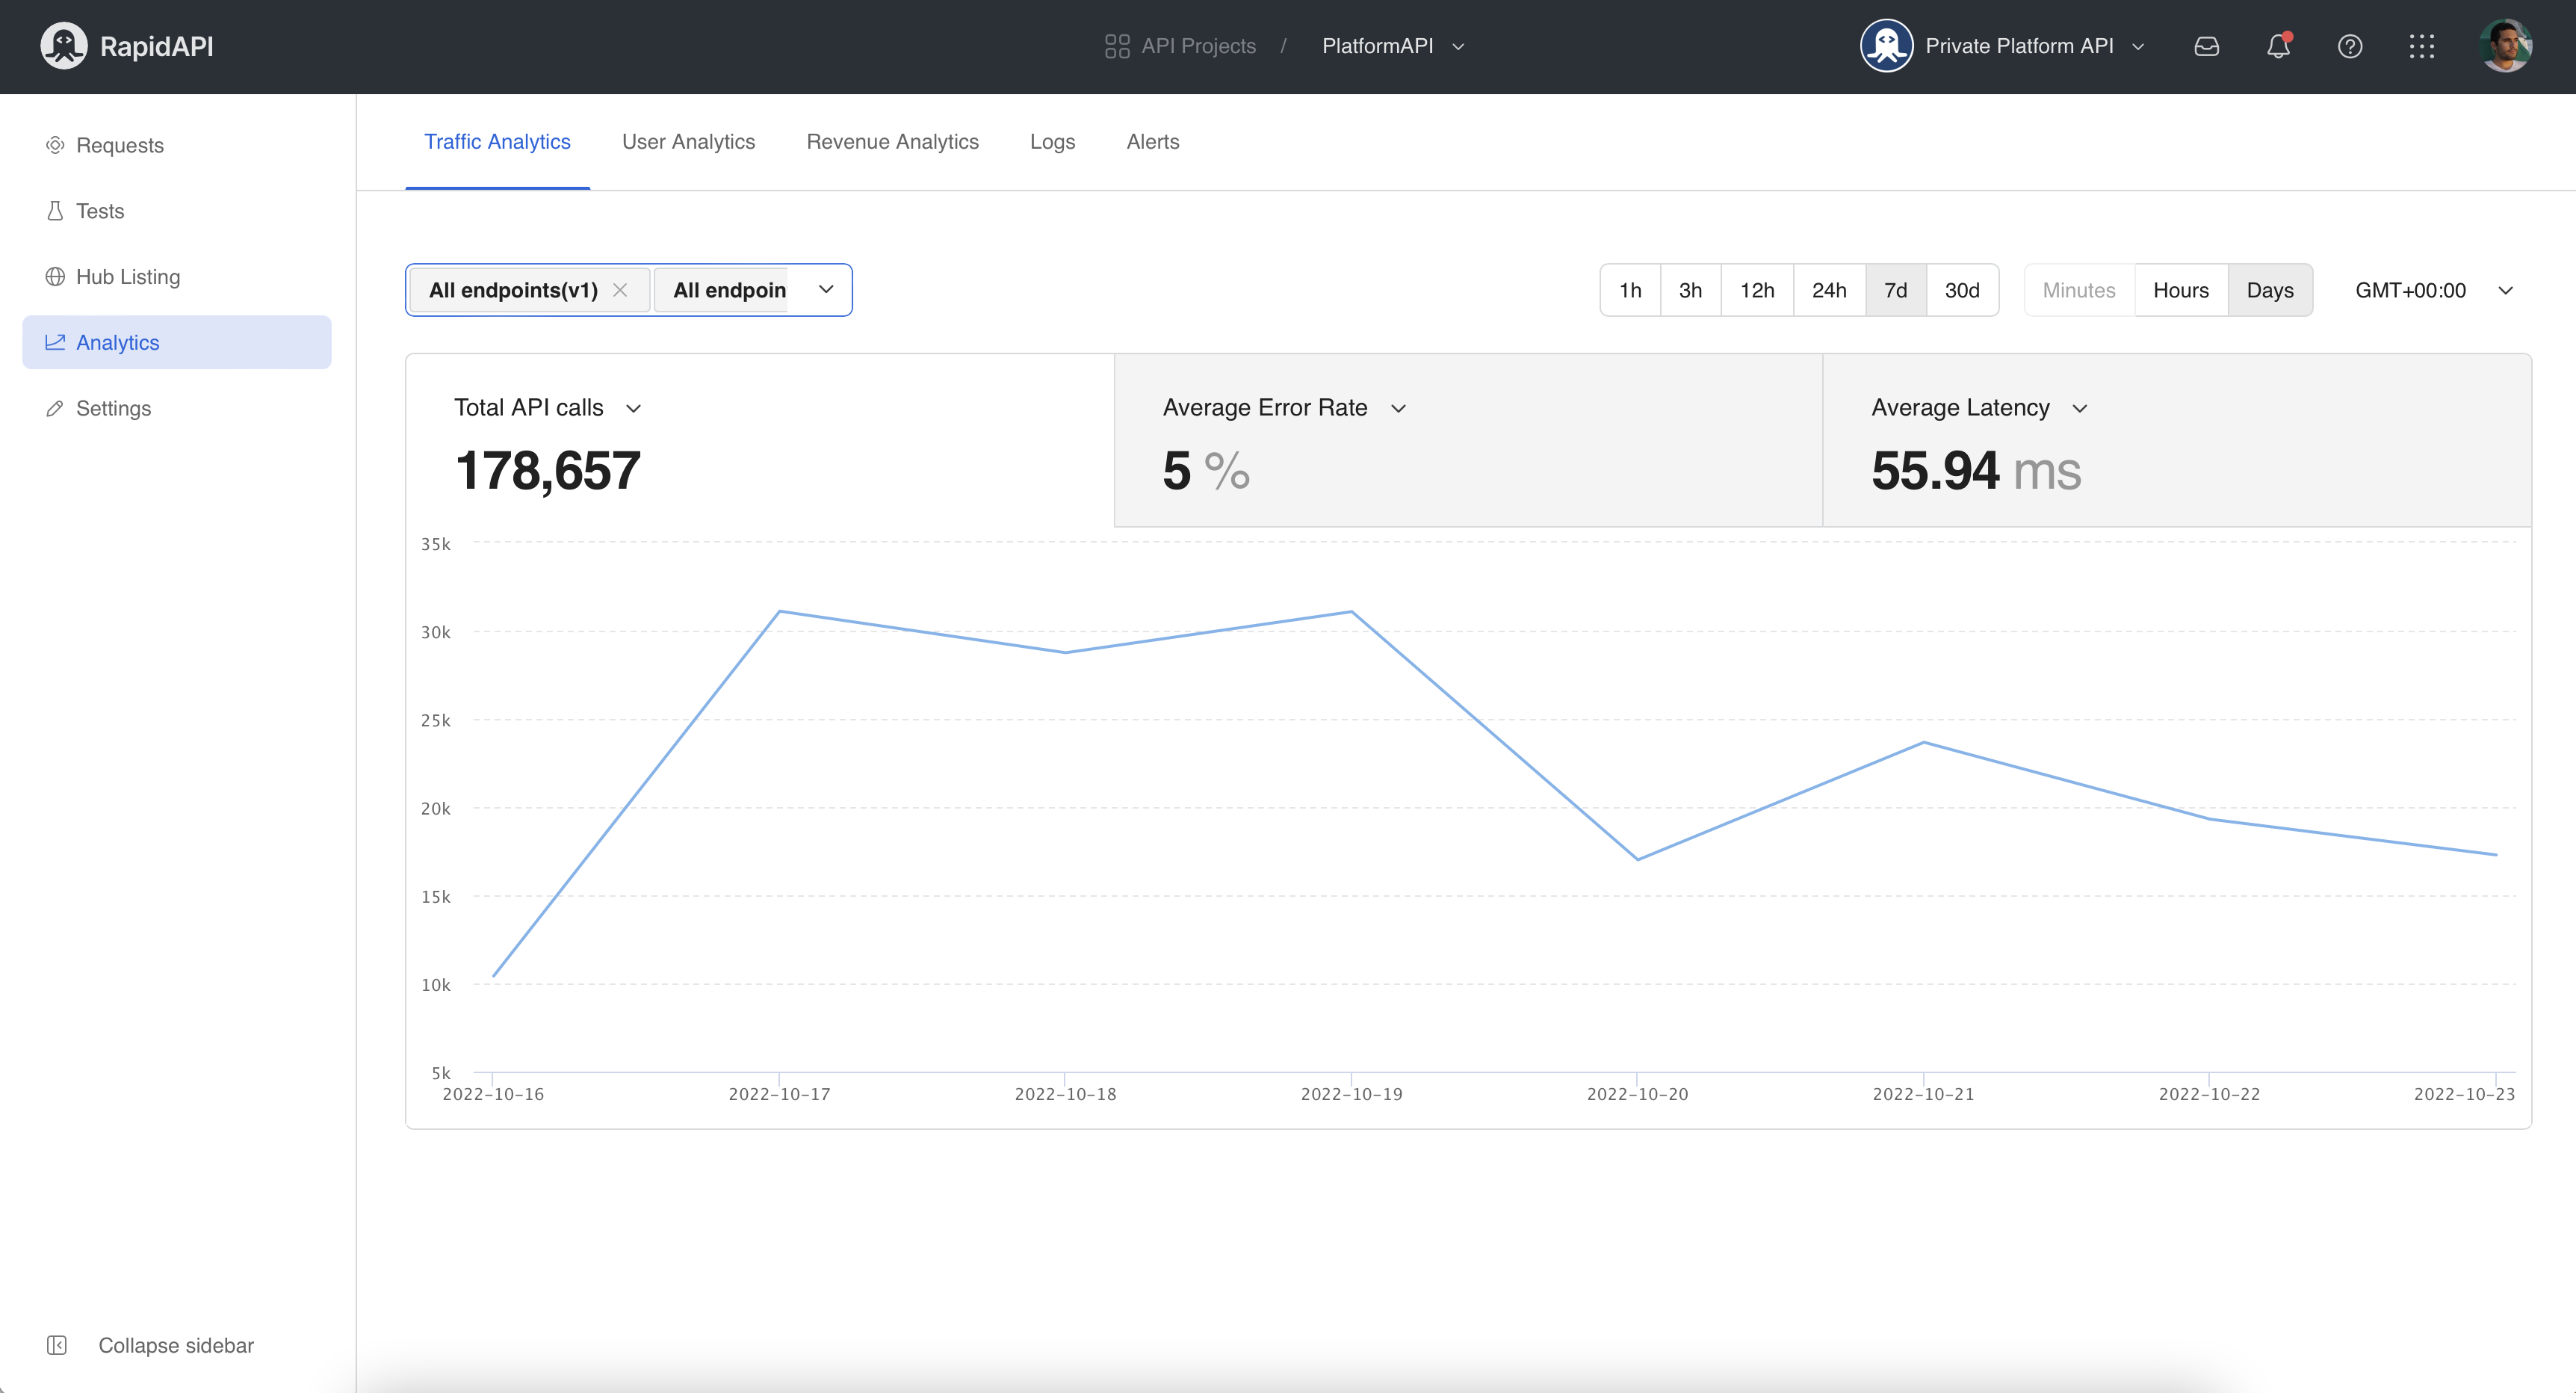
To view the analytics from the API provider perspective, navigate to Studio (My APIs). Click the Analytics tab for the API configured in step 1 above.

Updated 11 months ago