
App Analytics
How to view analytics for your applications
You can view analytics specific to each app in your account from the Developer Dashboard. To do so, switch over to the Analytics tab of your application in the dashboard.
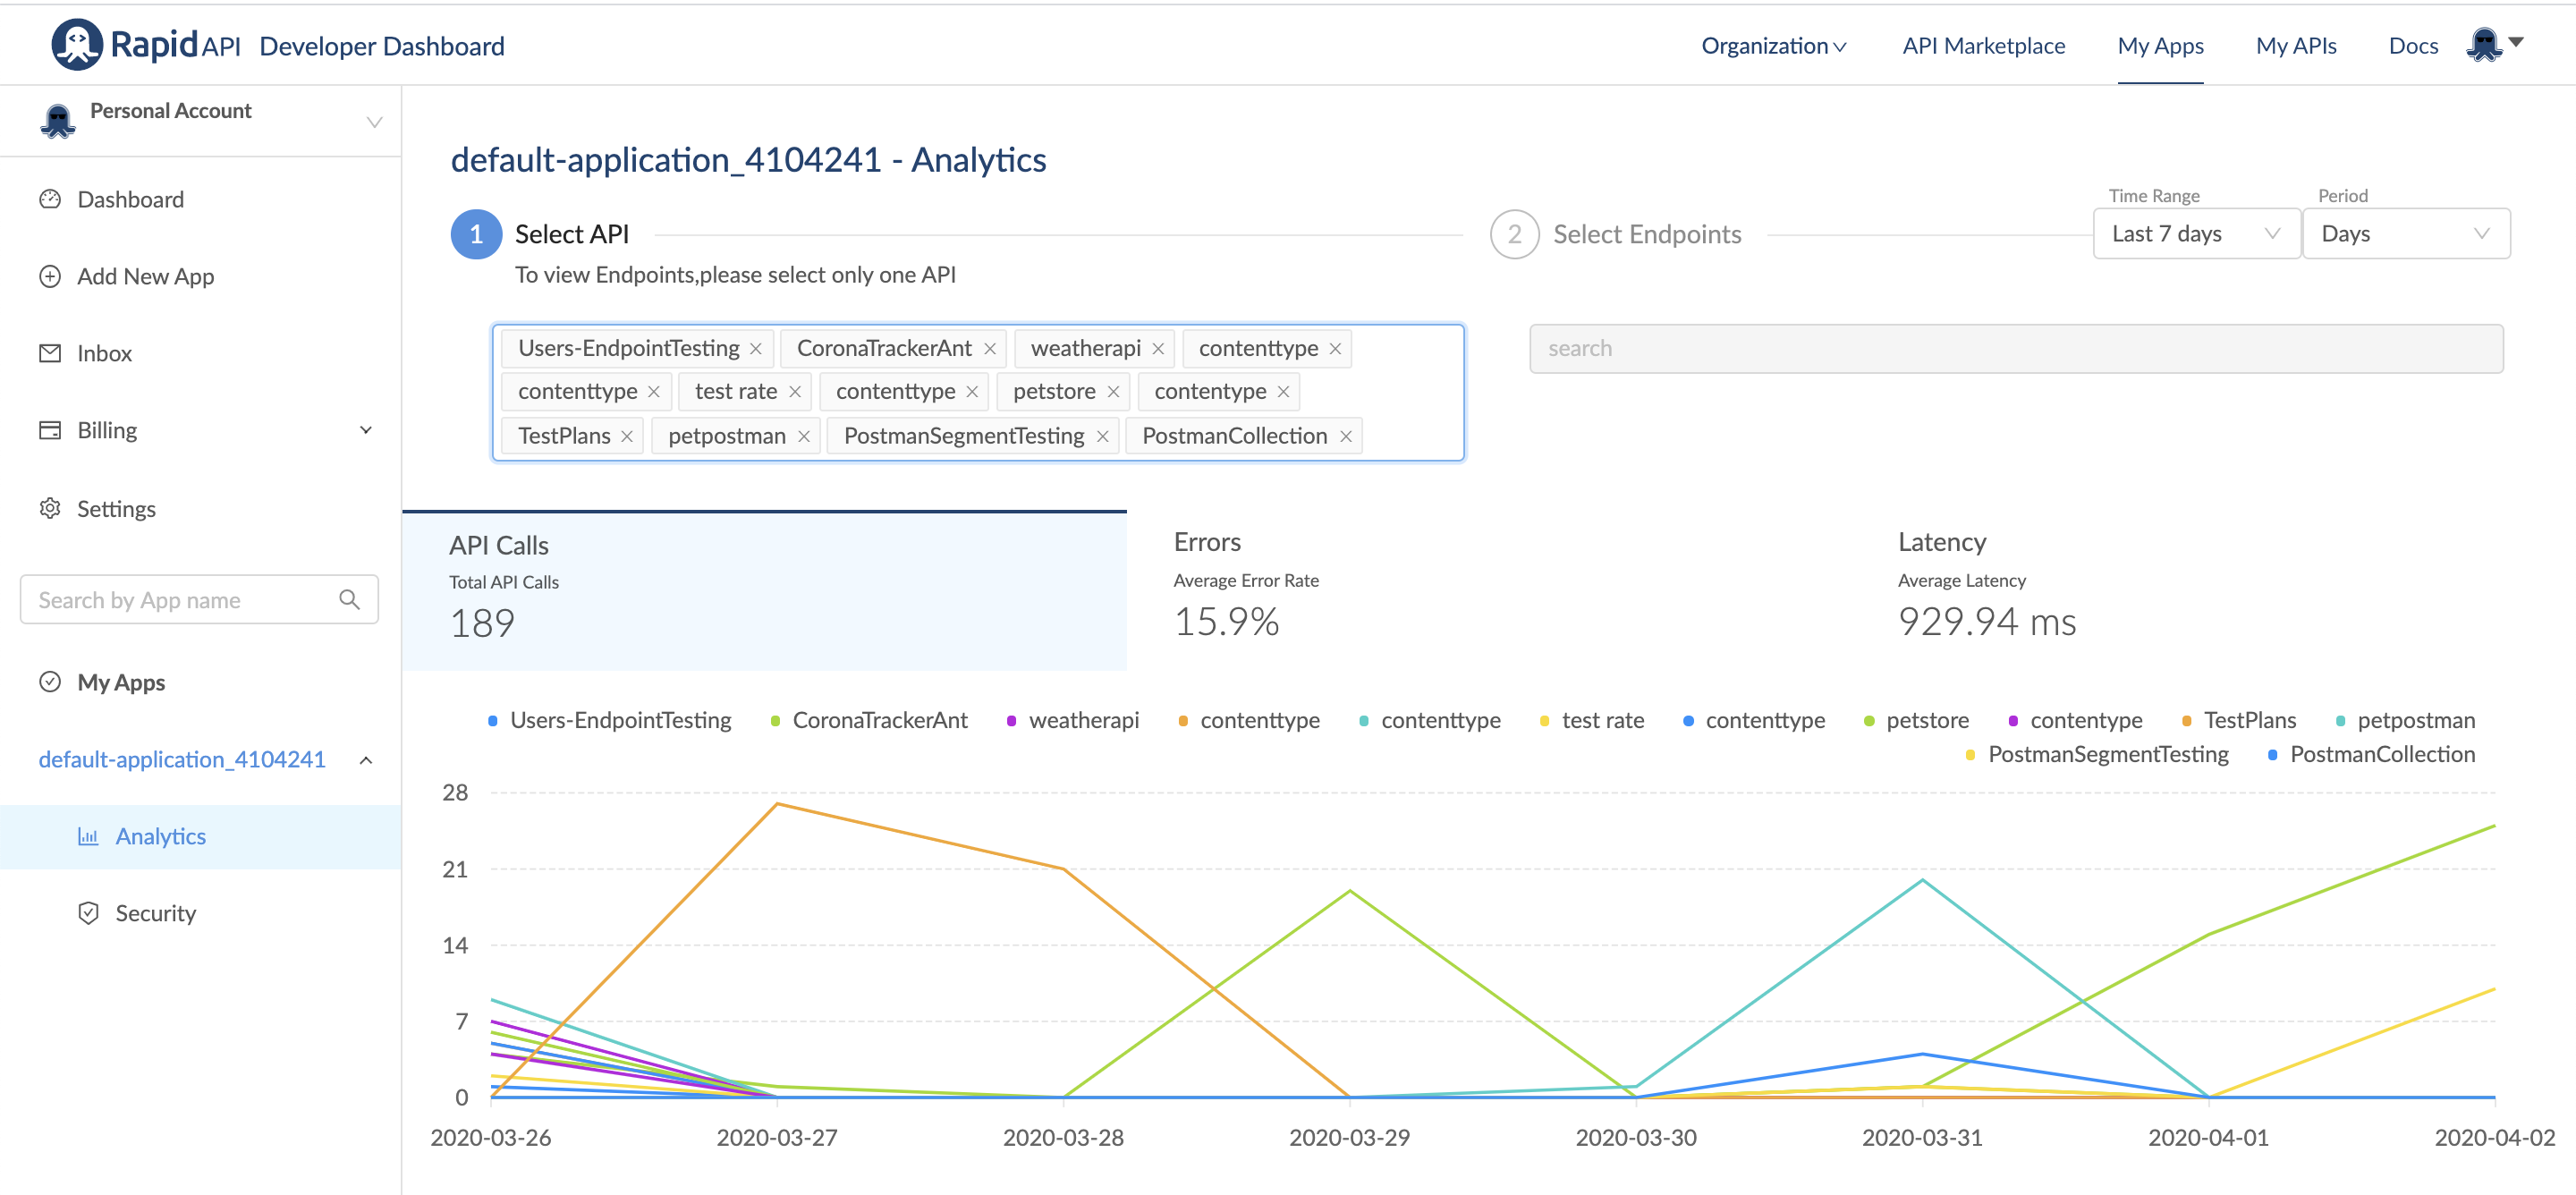
On the top of the page, you'll be able to see a chart with all the calls being made to all the APIs your app is connected to. You'll also be able to see a log with all the request data. You are able to filter these analytics to only show certain APIs within the app.
In each graph, you can view the following metrics:
- API Calls: how many requests are being made
- Error rates: how many requests are error some
- Latency: how long (on average) requests take to execute
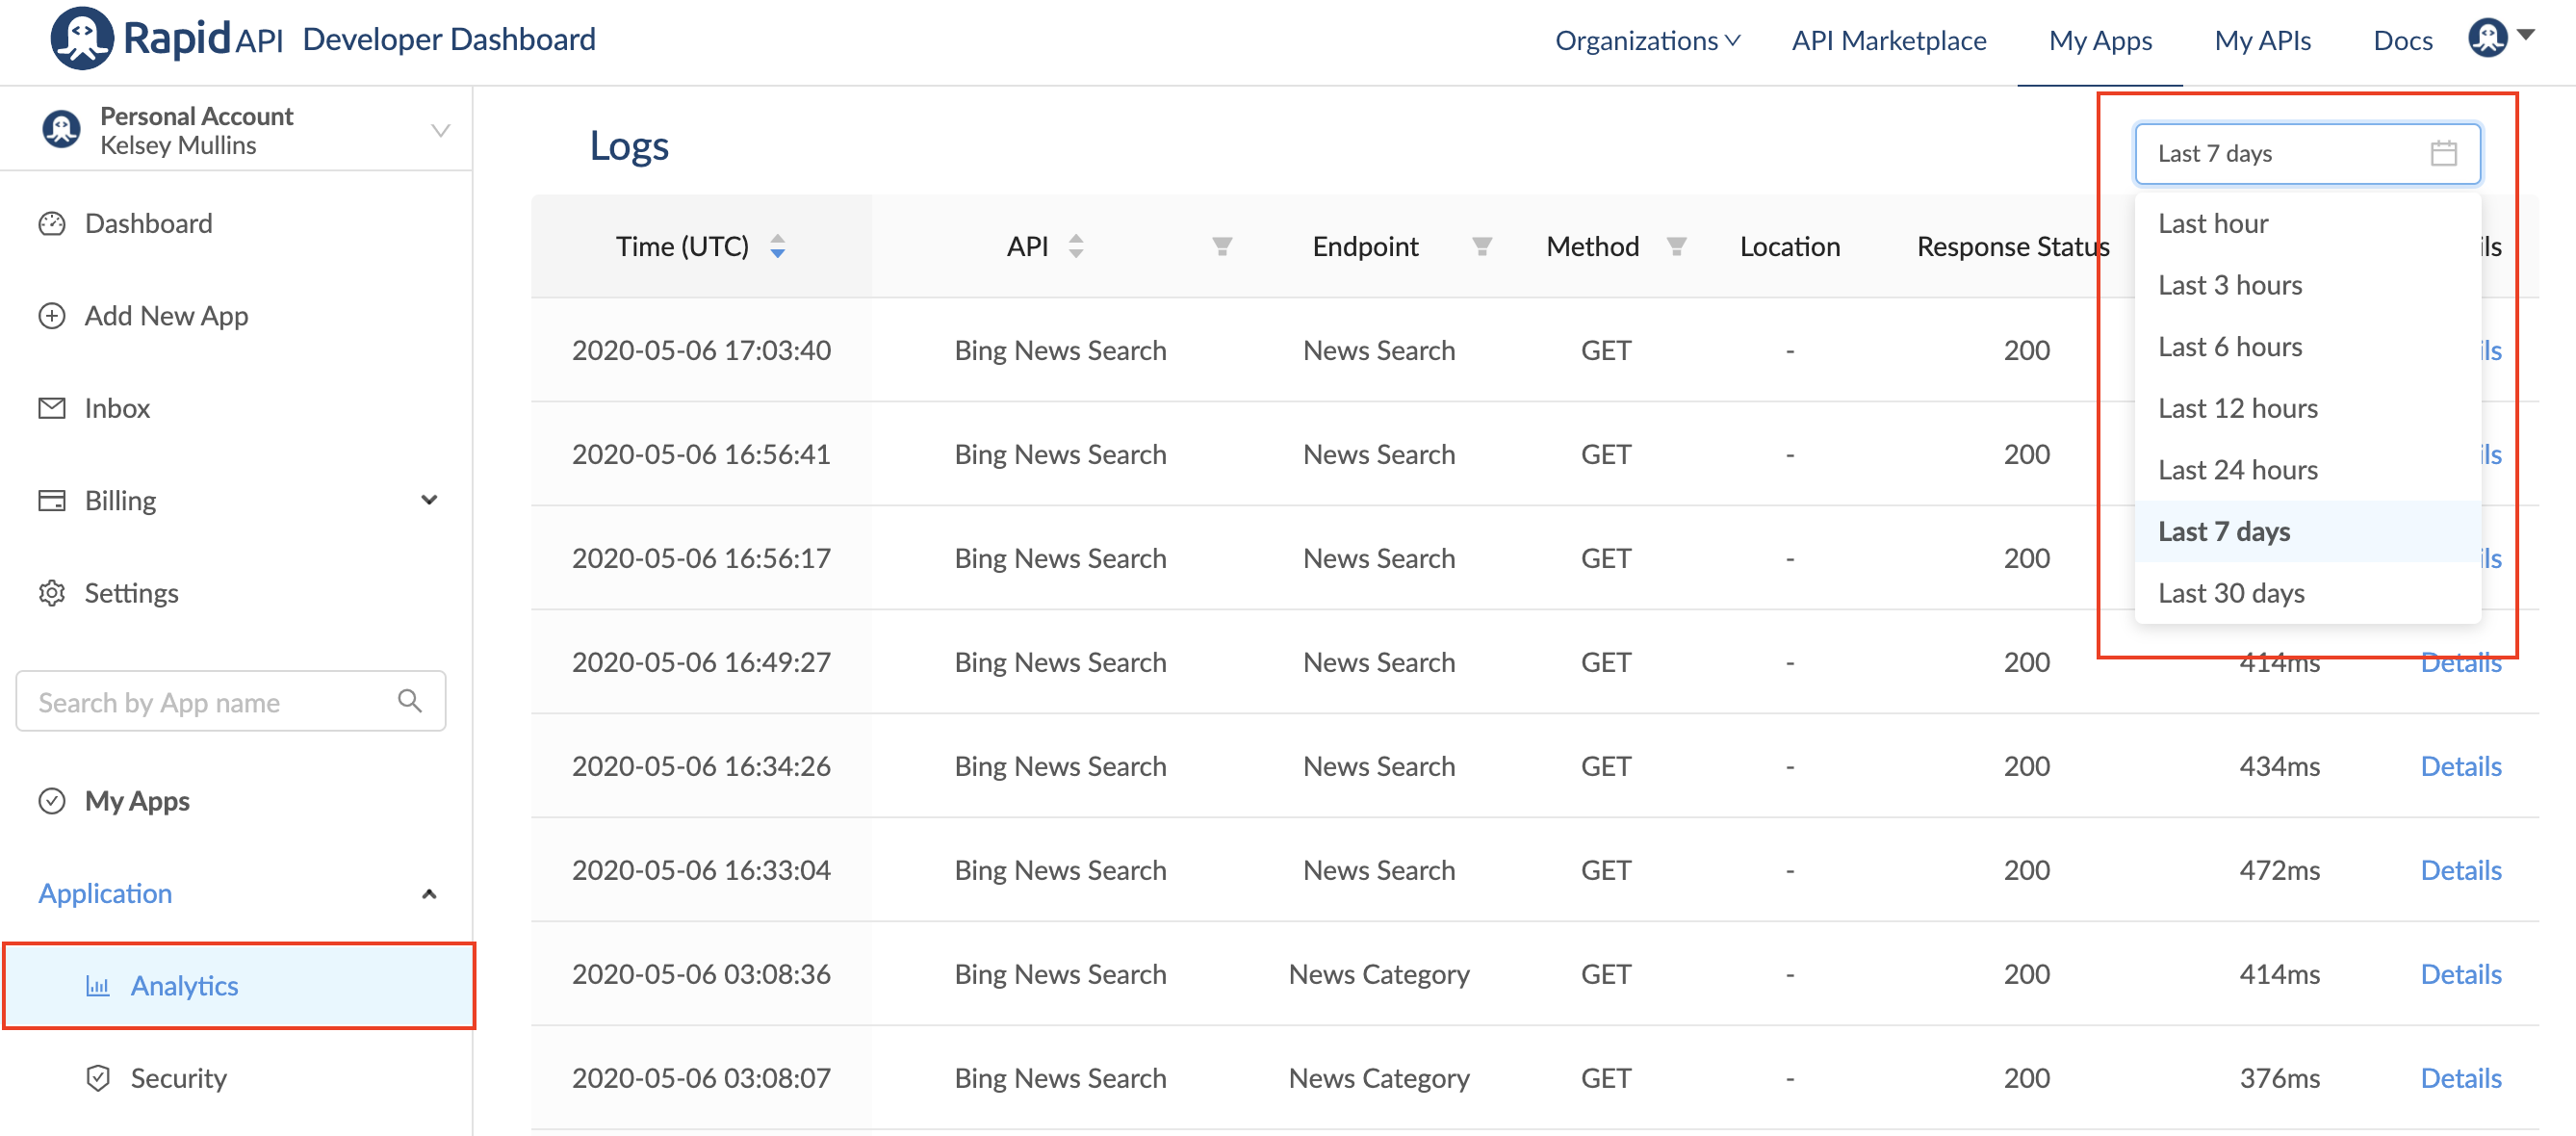
You may change the time period you're looking at by clicking the calendar icon and choosing a time range.
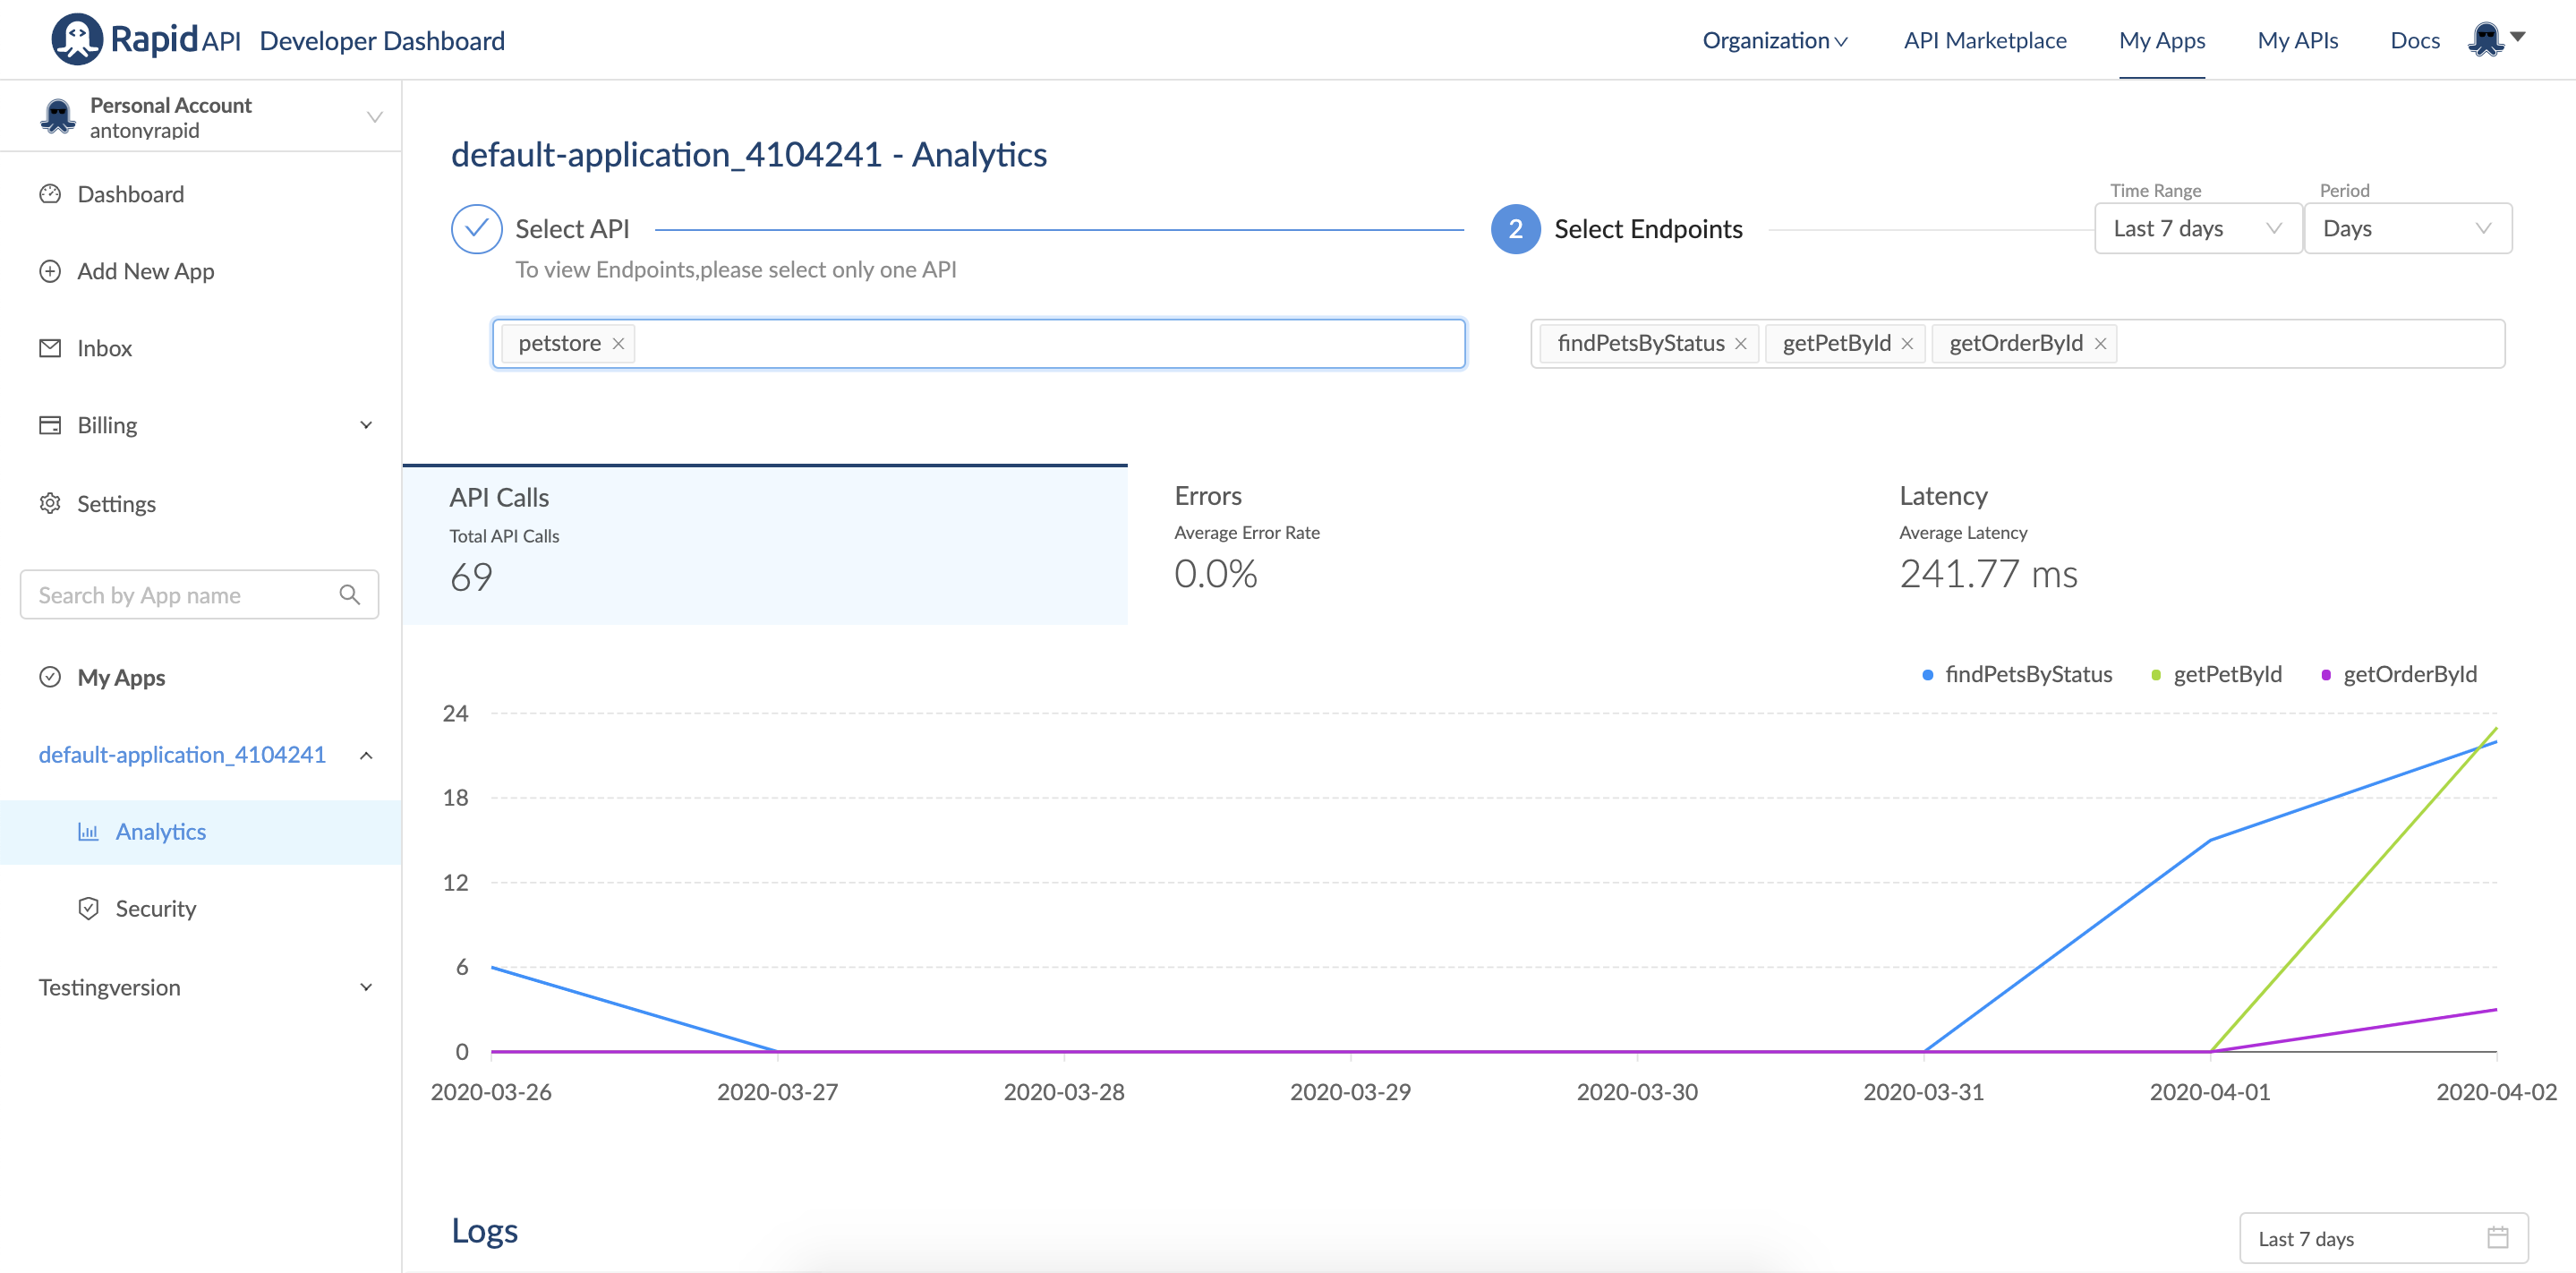
Filter by endpoint
You can also choose to see endpoint specific analytics. To do so, select a single API in the top bar. You can then select the specific endpoints you want. You will not be able to select endpoints if you have more than one API selected.
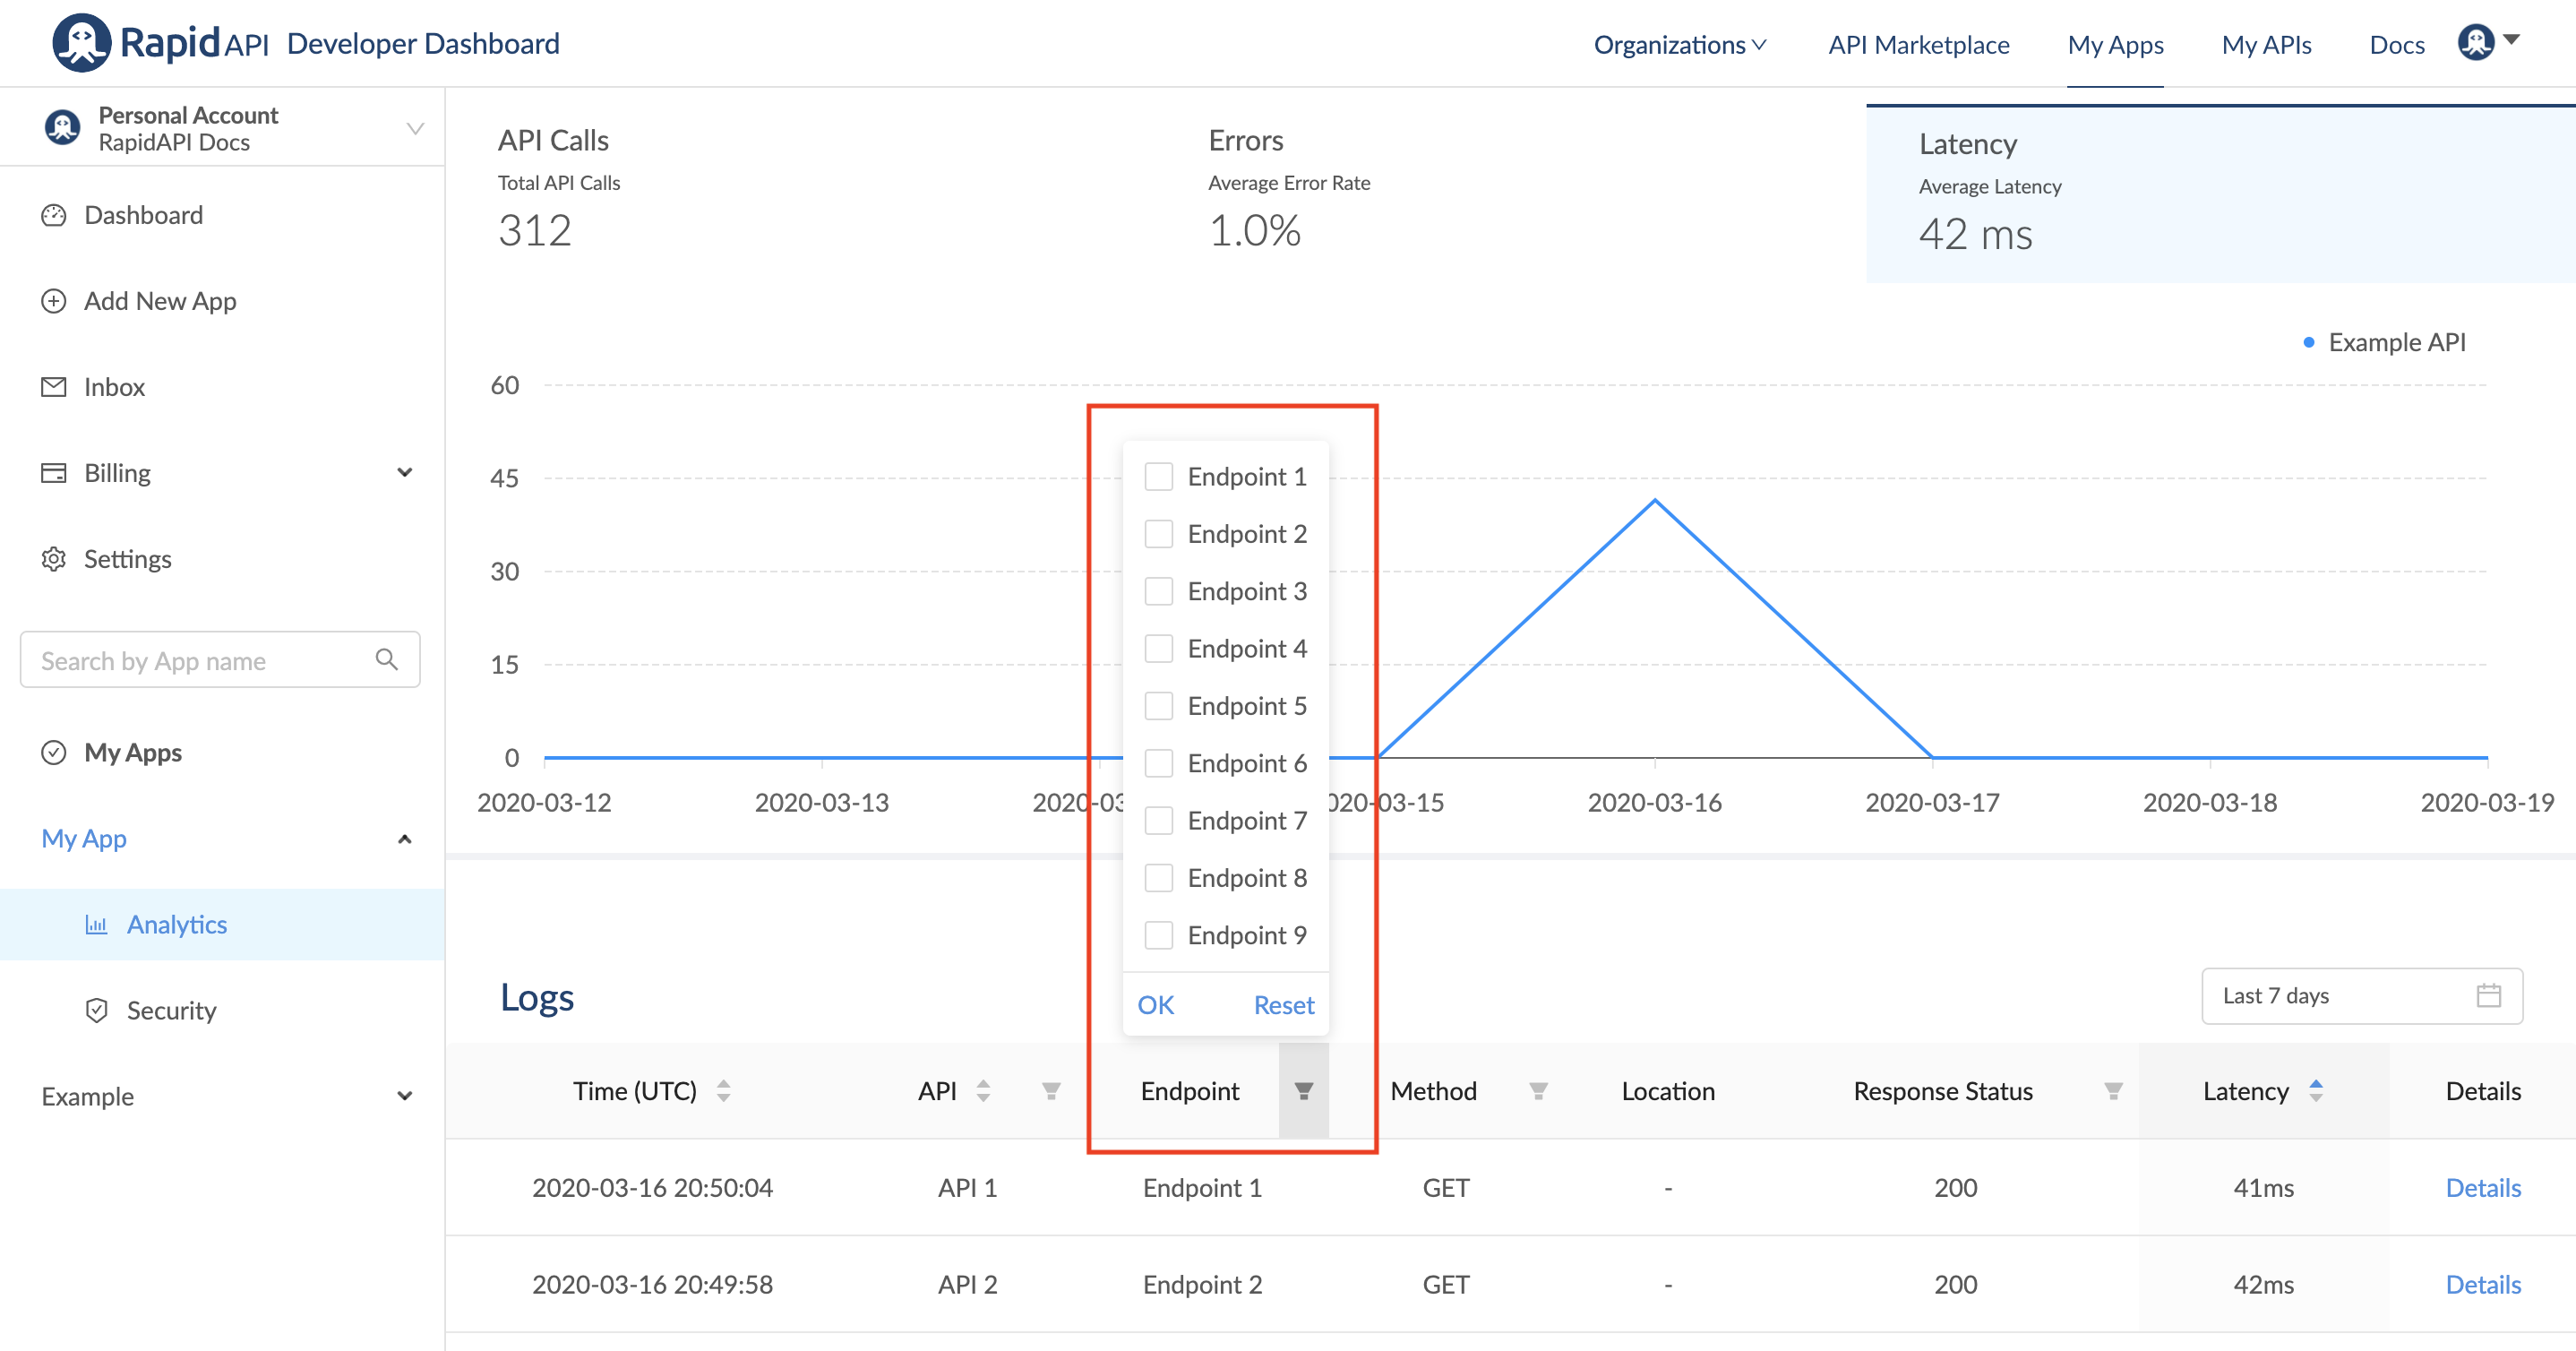
Logs
Below the graph, you can view logs that detail all of your app's API requests. Information in the log includes the time, API, endpoint, method, response status, and latency. You can filter and sort information using the filter icons.

For example, you can filter by endpoint, API, or response status. This can be useful if you are trying to troubleshoot a specific API or endpoint.
Export logs
You can export your logs to a CSV file in a few steps.
1: Navigate to the Developer Dashboard and select the Analytics tab for the desired application.
2: Select the timeframe for the logs from the dropdown.
3: Click the "Export CSV" button.
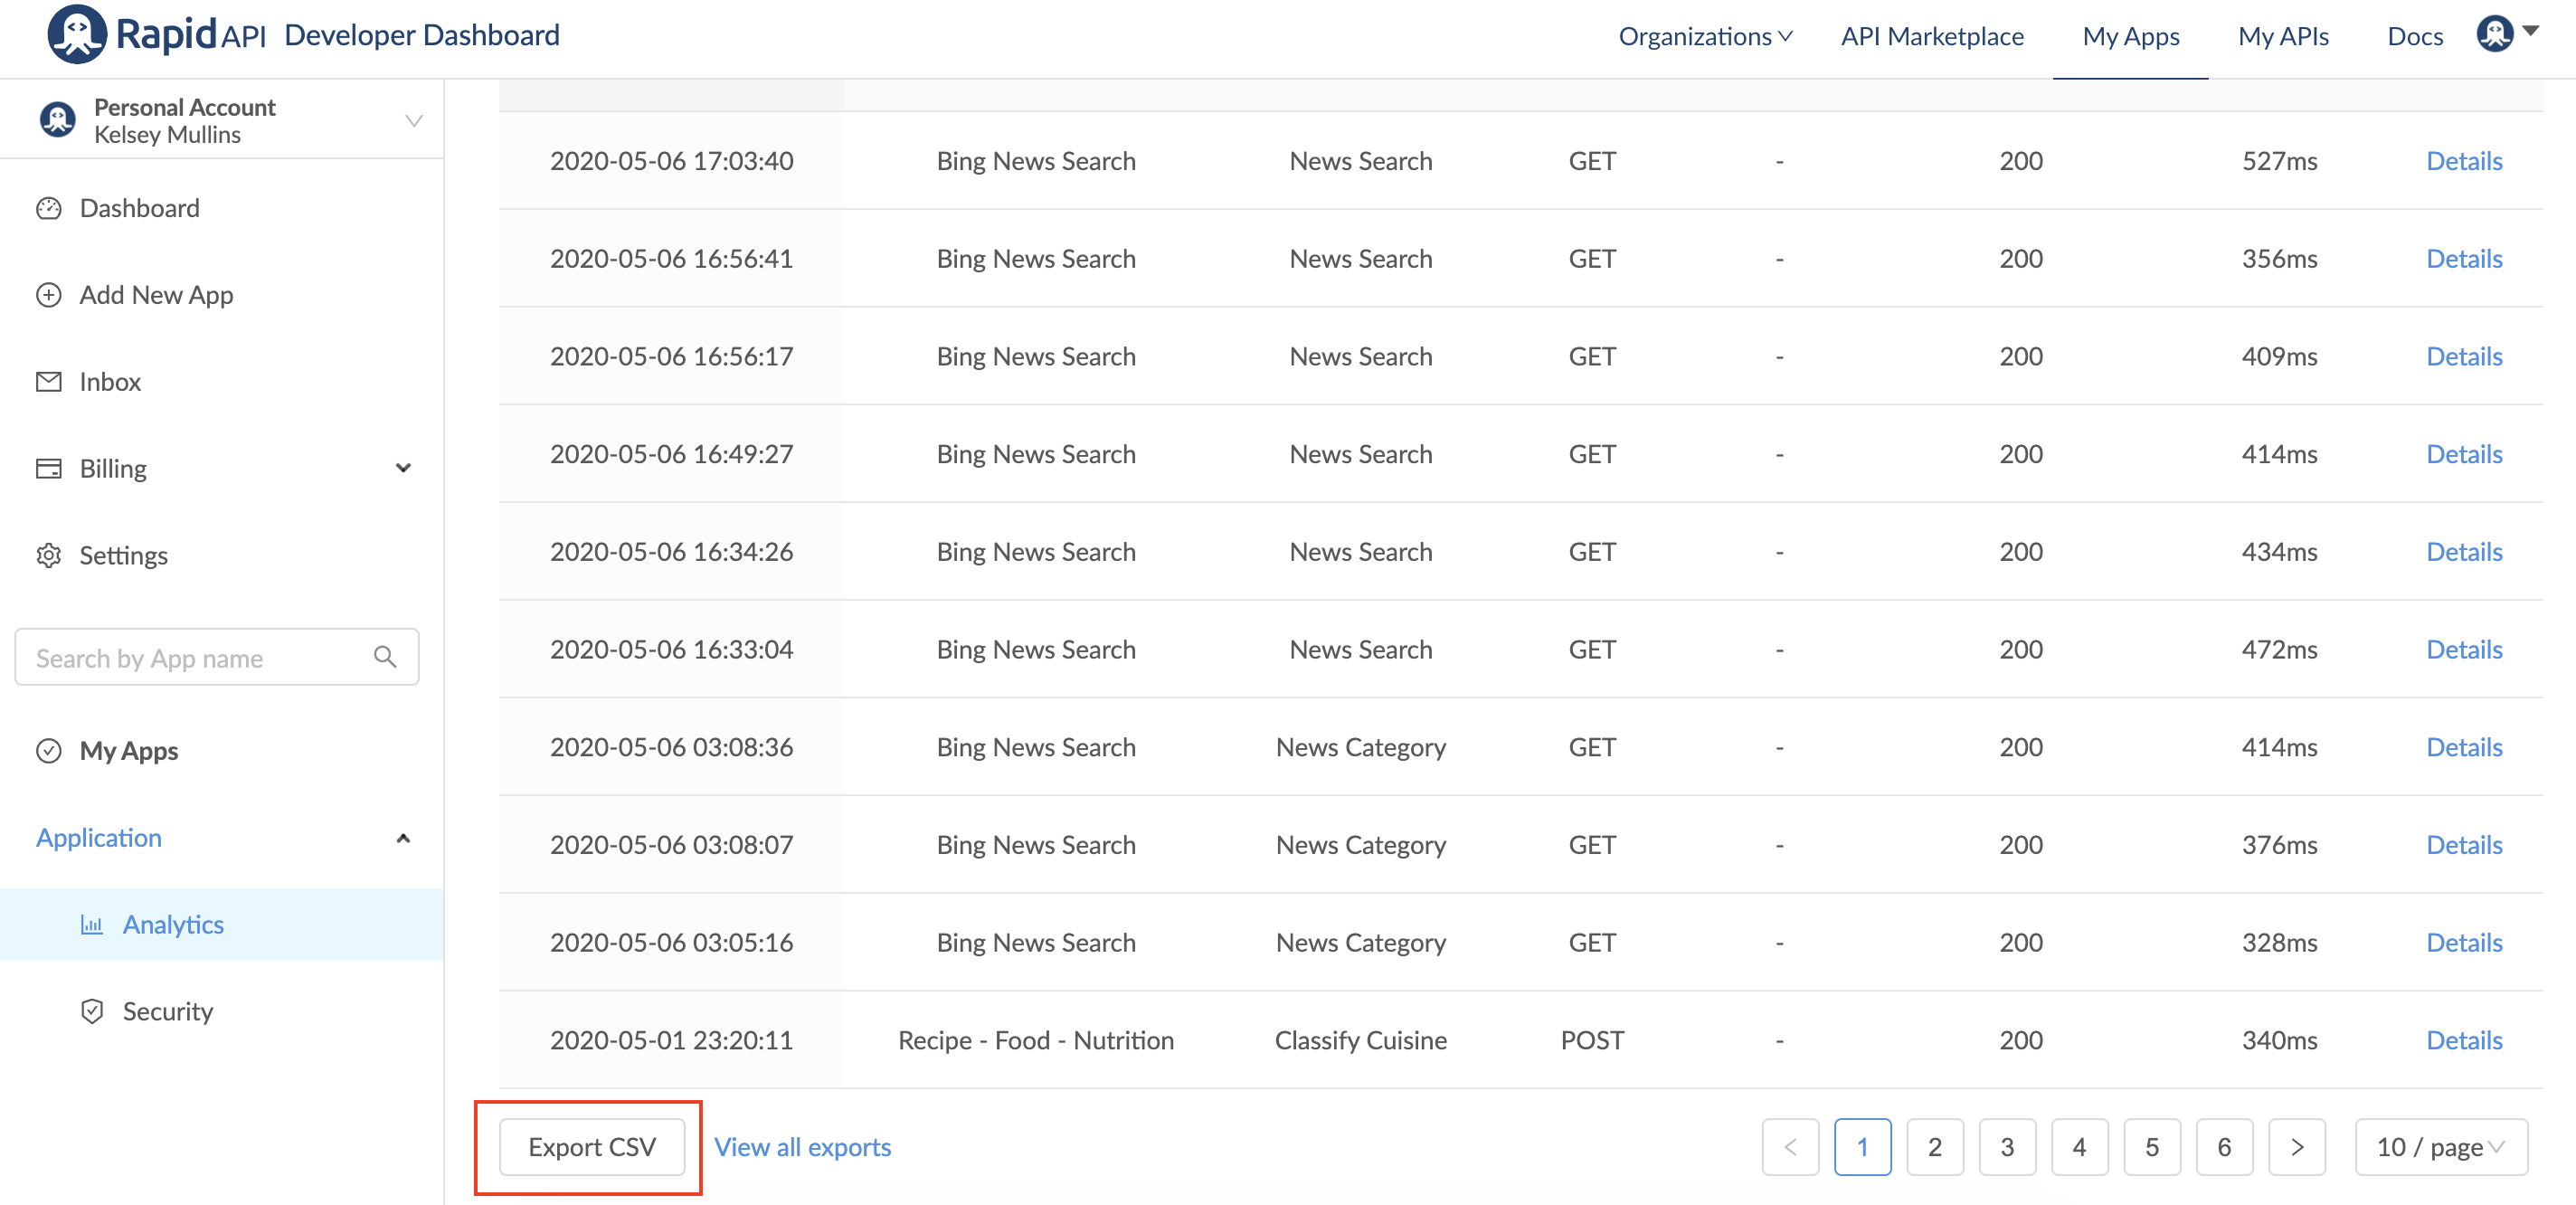
4: You will receive an email with a link to the download when the export is complete. You can also view the export when it is available by clicking the "View all exports" link next to the "Export CSV" button.
Updated about 1 year ago