
Dashboard
View comprehensive usage data for your API Hub.
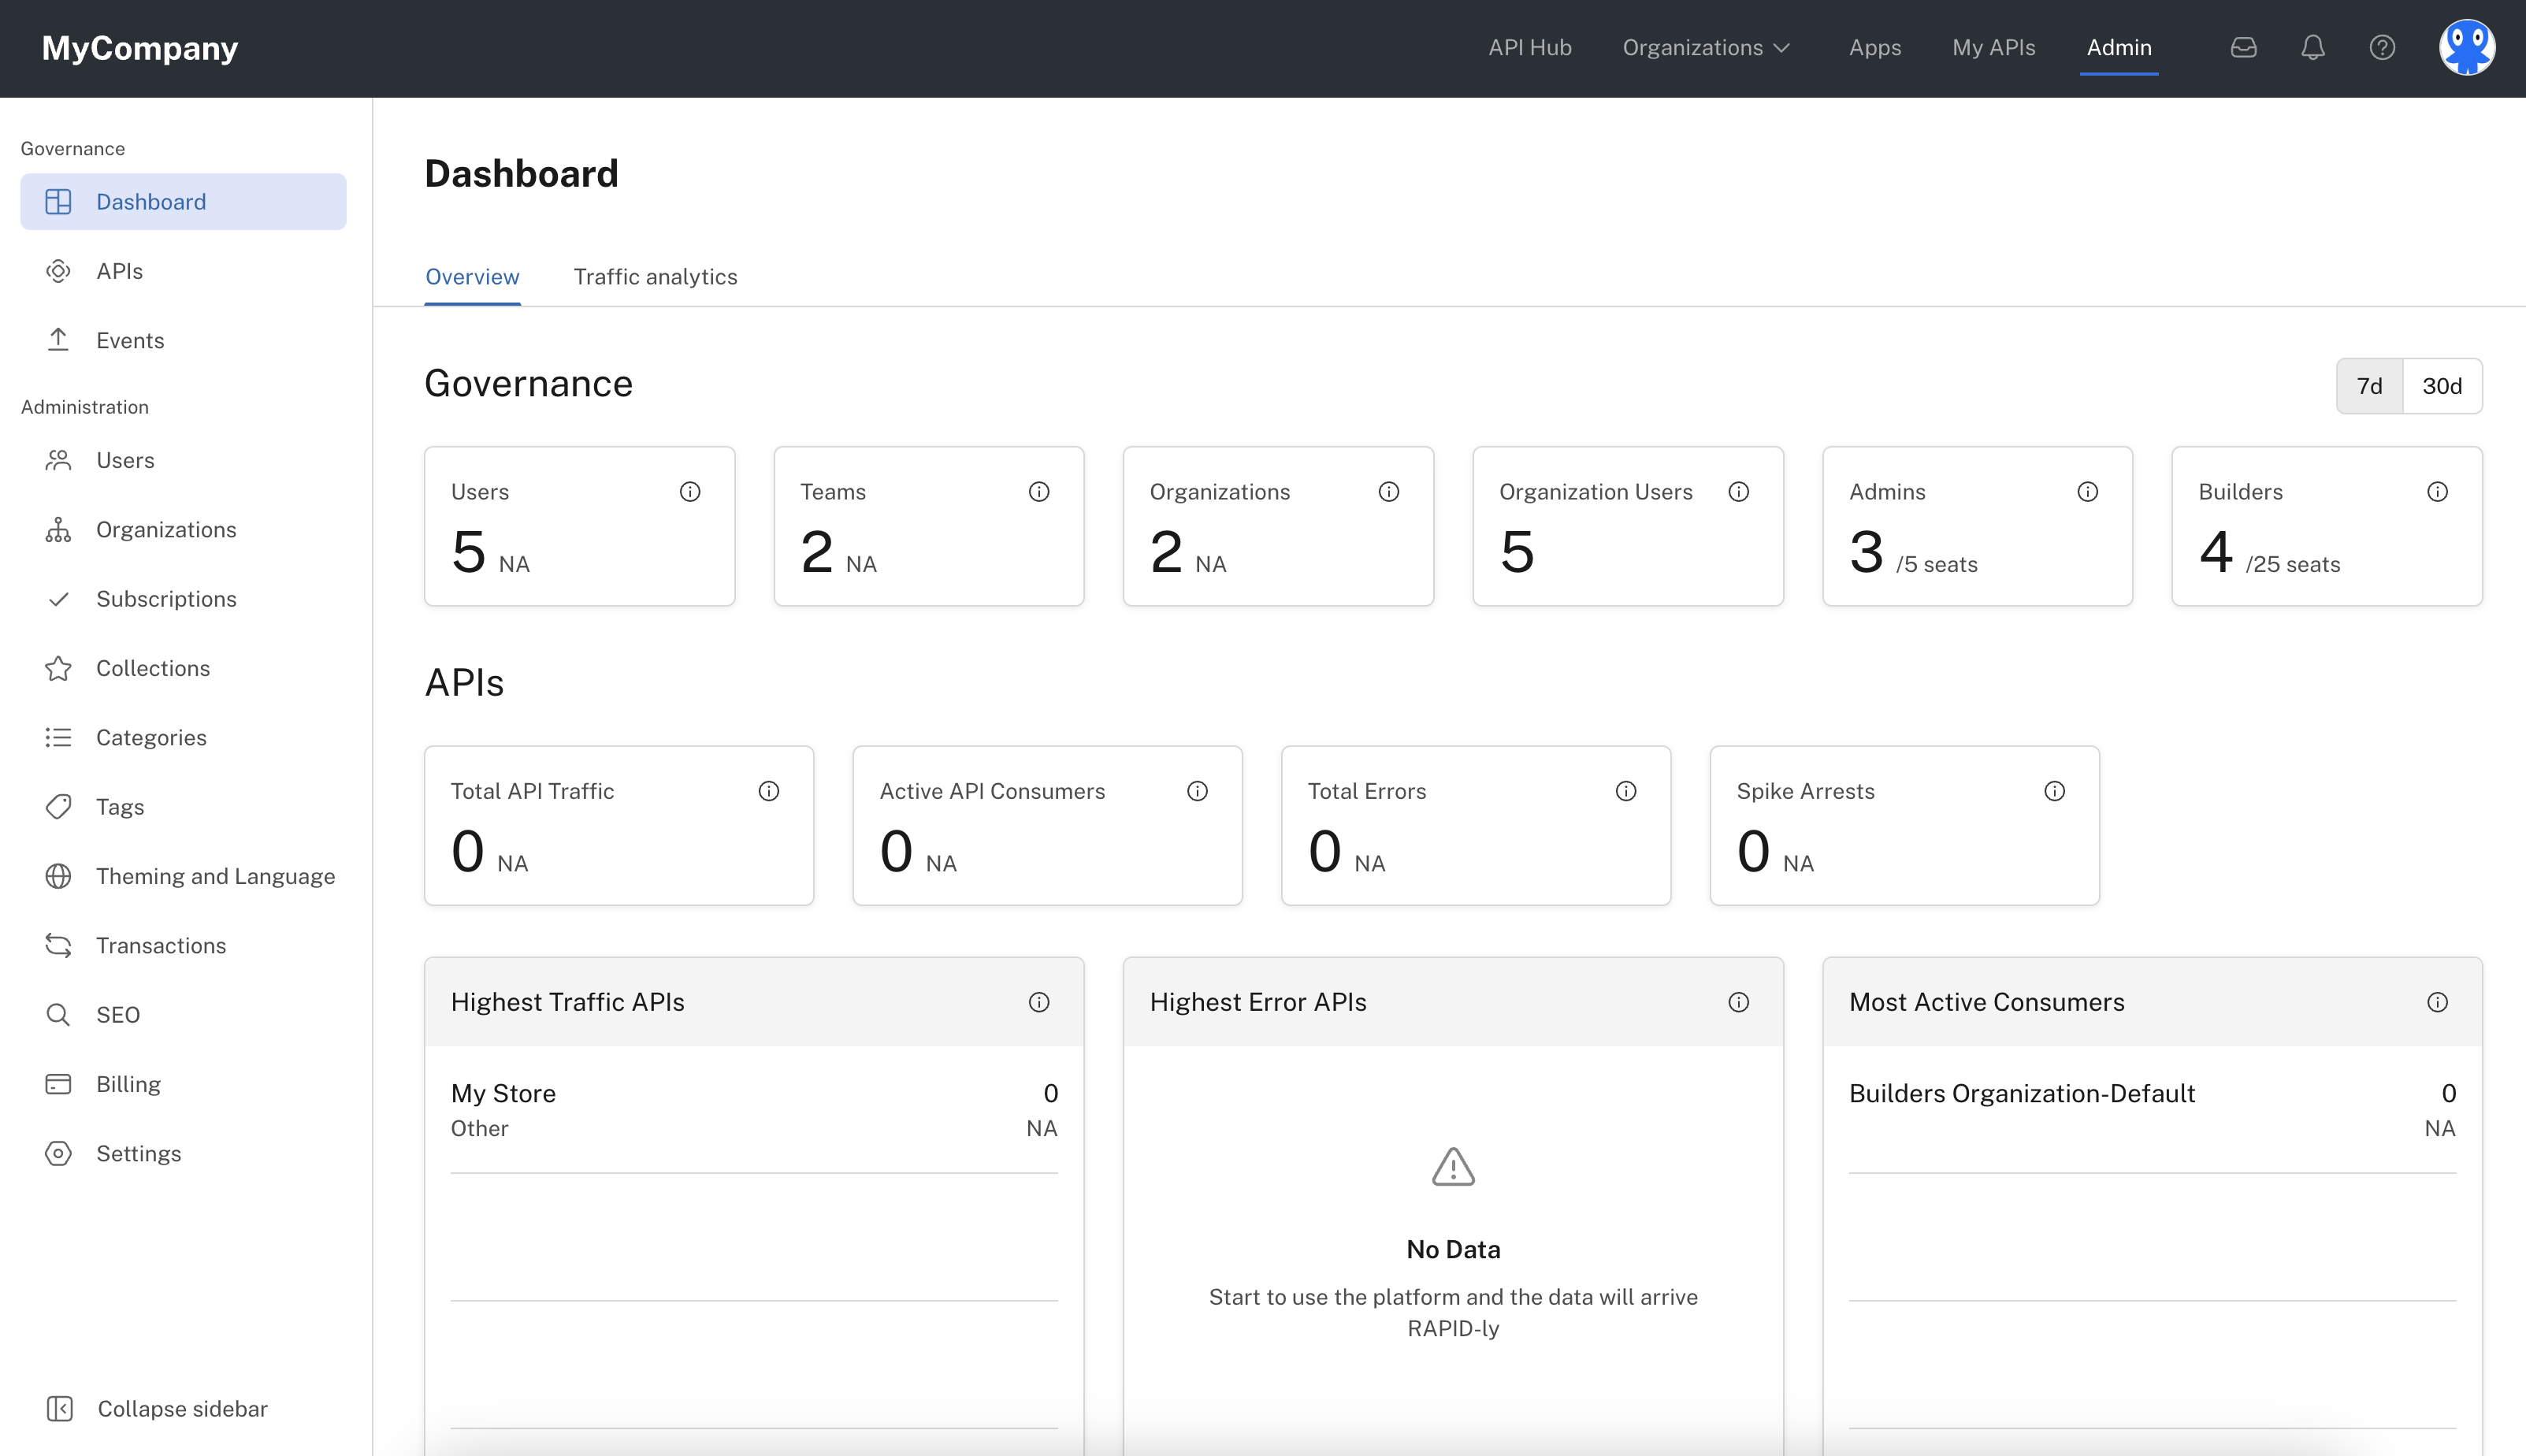
The Admin Panel's Dashboard tab provides a comprehensive view of usage in your RapidAPI Enterprise Hub. It is divided into two main tabs - Overview and Traffic analytics.
Admin Panel's Dashboard tab
Overview tab
The Overview tab displays four sections: Governance, APIs, Billing, and Hub. Use the 7d and 30d buttons on the right to show metrics trends over the last 7 or 30 days.
Governance
This section includes:
- Users: The total number of users in the Enterprise Hub. The small number to the right indicates the number of new users within the selected period.
- Teams: The total number of teams in the Enterprise Hub. The small number to the right indicates the number of new tams within the selected period.
- Organizations: The total number of organizations in the Enterprise Hub.
- Organization Users: The total number of users that are members of at least one organization.
- Admins: The total number of users that are Environment Admins in your Hub. This also shows the number of Environment Admins that are allowed in your plan.
- Builders: The total number of users that are API Builders or Organization Admins in your Hub. This also shows the number of API Builders that are allowed in your plan. Note - A user can belong to multiple teams and organizations, but will only be counted once in the total shown here.
APIs
This section includes:
- Total API Traffic: The total count of all API calls made. This helps monitor the trends of API traffic and identify potential threats.
- Active API Consumers: The number of teams or users who made at least one API call within the selected period. This can provide insights into the level of engagement of an API and help inform decisions related to capacity planning, resource allocation, and product development.
- Total Errors: The count of API requests that returned an error code within the selected period. This helps detect potential issues or risks.
- Spike Arrests: The count of all API calls that responded with the error code 429 (Too Many Requests). This is important in monitoring spikes in API traffic and detecting potential security threats.
- Highest Traffic APIs: The five APIs with the highest amount of API calls made during the selected period. This can help organizations identify potential traffic spikes and proactively address them to ensure their APIs remain available and responsive.
- Highest Error APIs: The five APIs with the highest error rate. This can be used to pinpoint areas for improvement.
- Most Active Consumers: The five users or teams making the highest number of API calls. This can reveal partnership opportunities and provide customer insights.
Billing
This section includes:
- Gross Volume: Estimated amount of all successful payments including payments that are refunded or disputed.
- Net Volume: Estimated revenue from payments after refunds and disputes. Does not include Stripe's fees.
- Successful Payments: Number of all successful payments including payments that are refunded or disputed.
Hub
This section includes:
- Public APIs: The total number of public APIs on the Enterprise Hub. Public APIs are discoverable by any use logged into the Enterprise Hub.
- Private APIs: The total number of private APIs on the Enterprise Hub. Private APIs are discoverable only by the user or team that owns the API, or by entities (users, teams, organizations) that have been invited to consume the API.
Traffic analytics tab
This page contains a near-real-time chart (up to a five min delay) that can be used to analyze your overall API traffic load, error rate, and latency. Based on the time periods you want to show, different resolutions can be used.
For each of those dimensions, you can replace the aggregation function to show the average, median, max, min, or total. Do this by opening the dropdown near the dimension for which you would like to change the aggregation function.

Traffic analytics tab of the Admin Panel's dashboard
In addition, you can change the line chart to display any of the dimensions by clicking that tab.

Viewing the Average Error Rate in the Admin Panel's dashboard
On the top left of the chart, you will find the API filter, which can be used to scope your search to a specific set of APIs.
Updated about 1 year ago