Testing Dashboard
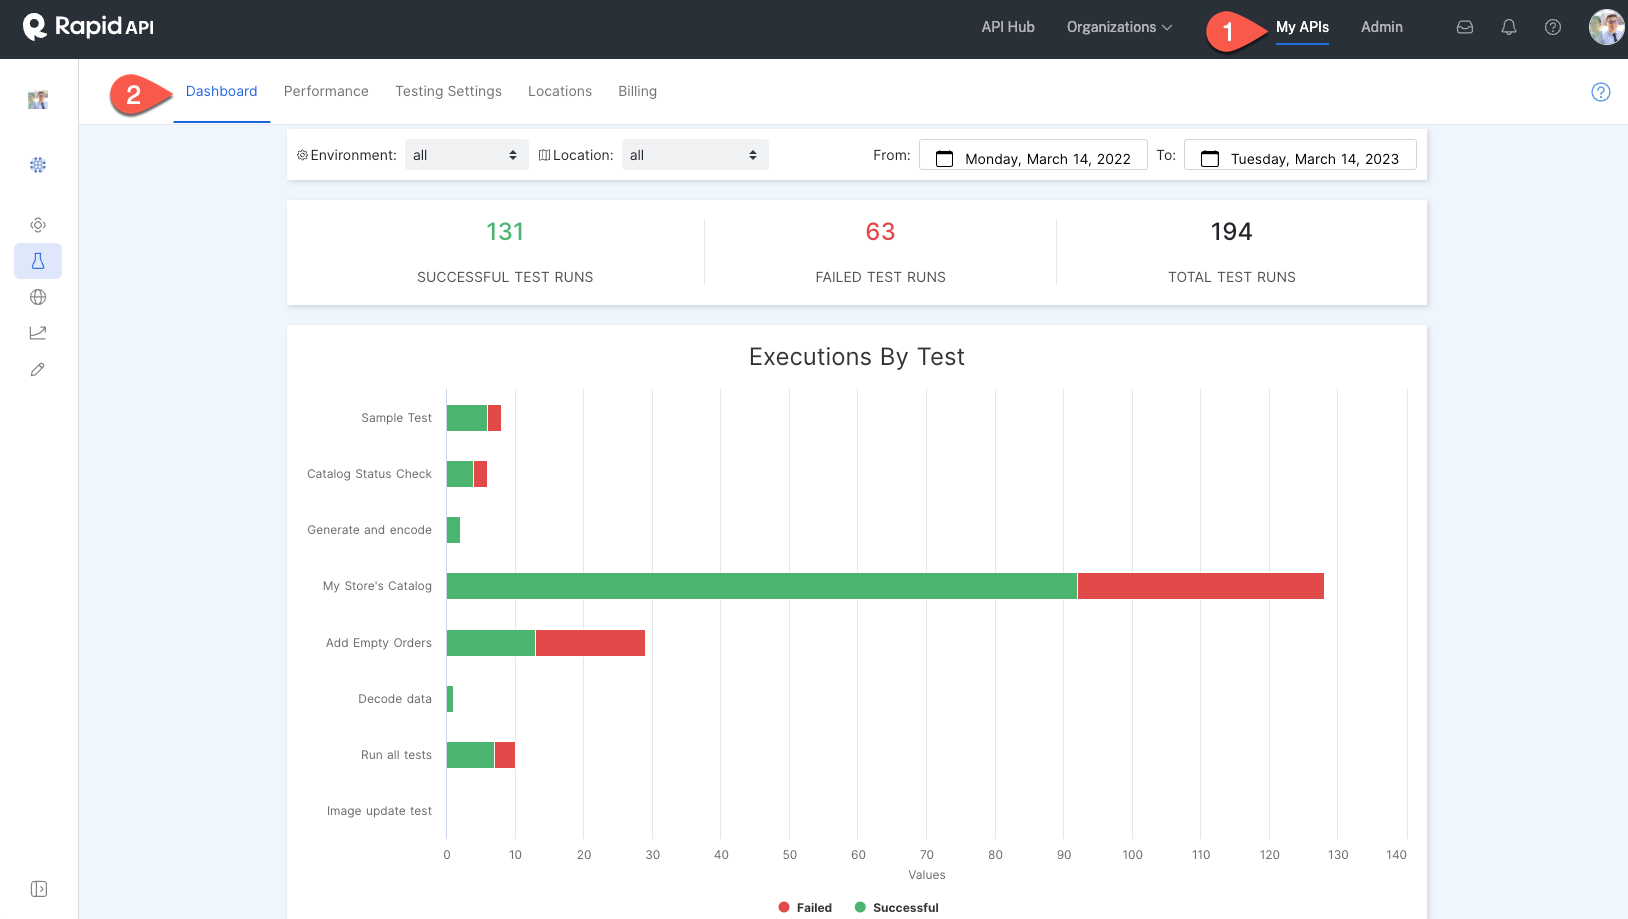
The Testing Dashboard helps get a holistic overview of your API by including analytics for every test in your API Project. The Dashboard displays the following:
- Total, successful, and failed test executions
- Execution By Test graph: This graph shows the total, successful, and failed test executions by test.
- Executions Over Time graph: This graph displays the total number of test executions in the API Project over time. You can adjust the resolution of this graph from days to hours.
- Latency By Test graph: This graph displays the average duration of each test.
- Test Durations graph: This graph displays the minimum, average, and maximum test durations over time. You can adjust the resolution of this graph by test and from days to hours.
You can filter all the analytics in the Dashboard by adjusting the environment, location, and date range fields at the top of the page.
You can access the testing Dashboard by navigating to Studio, selecting your API Project, and clicking Dashboard.

Updated 10 months ago