Alerts
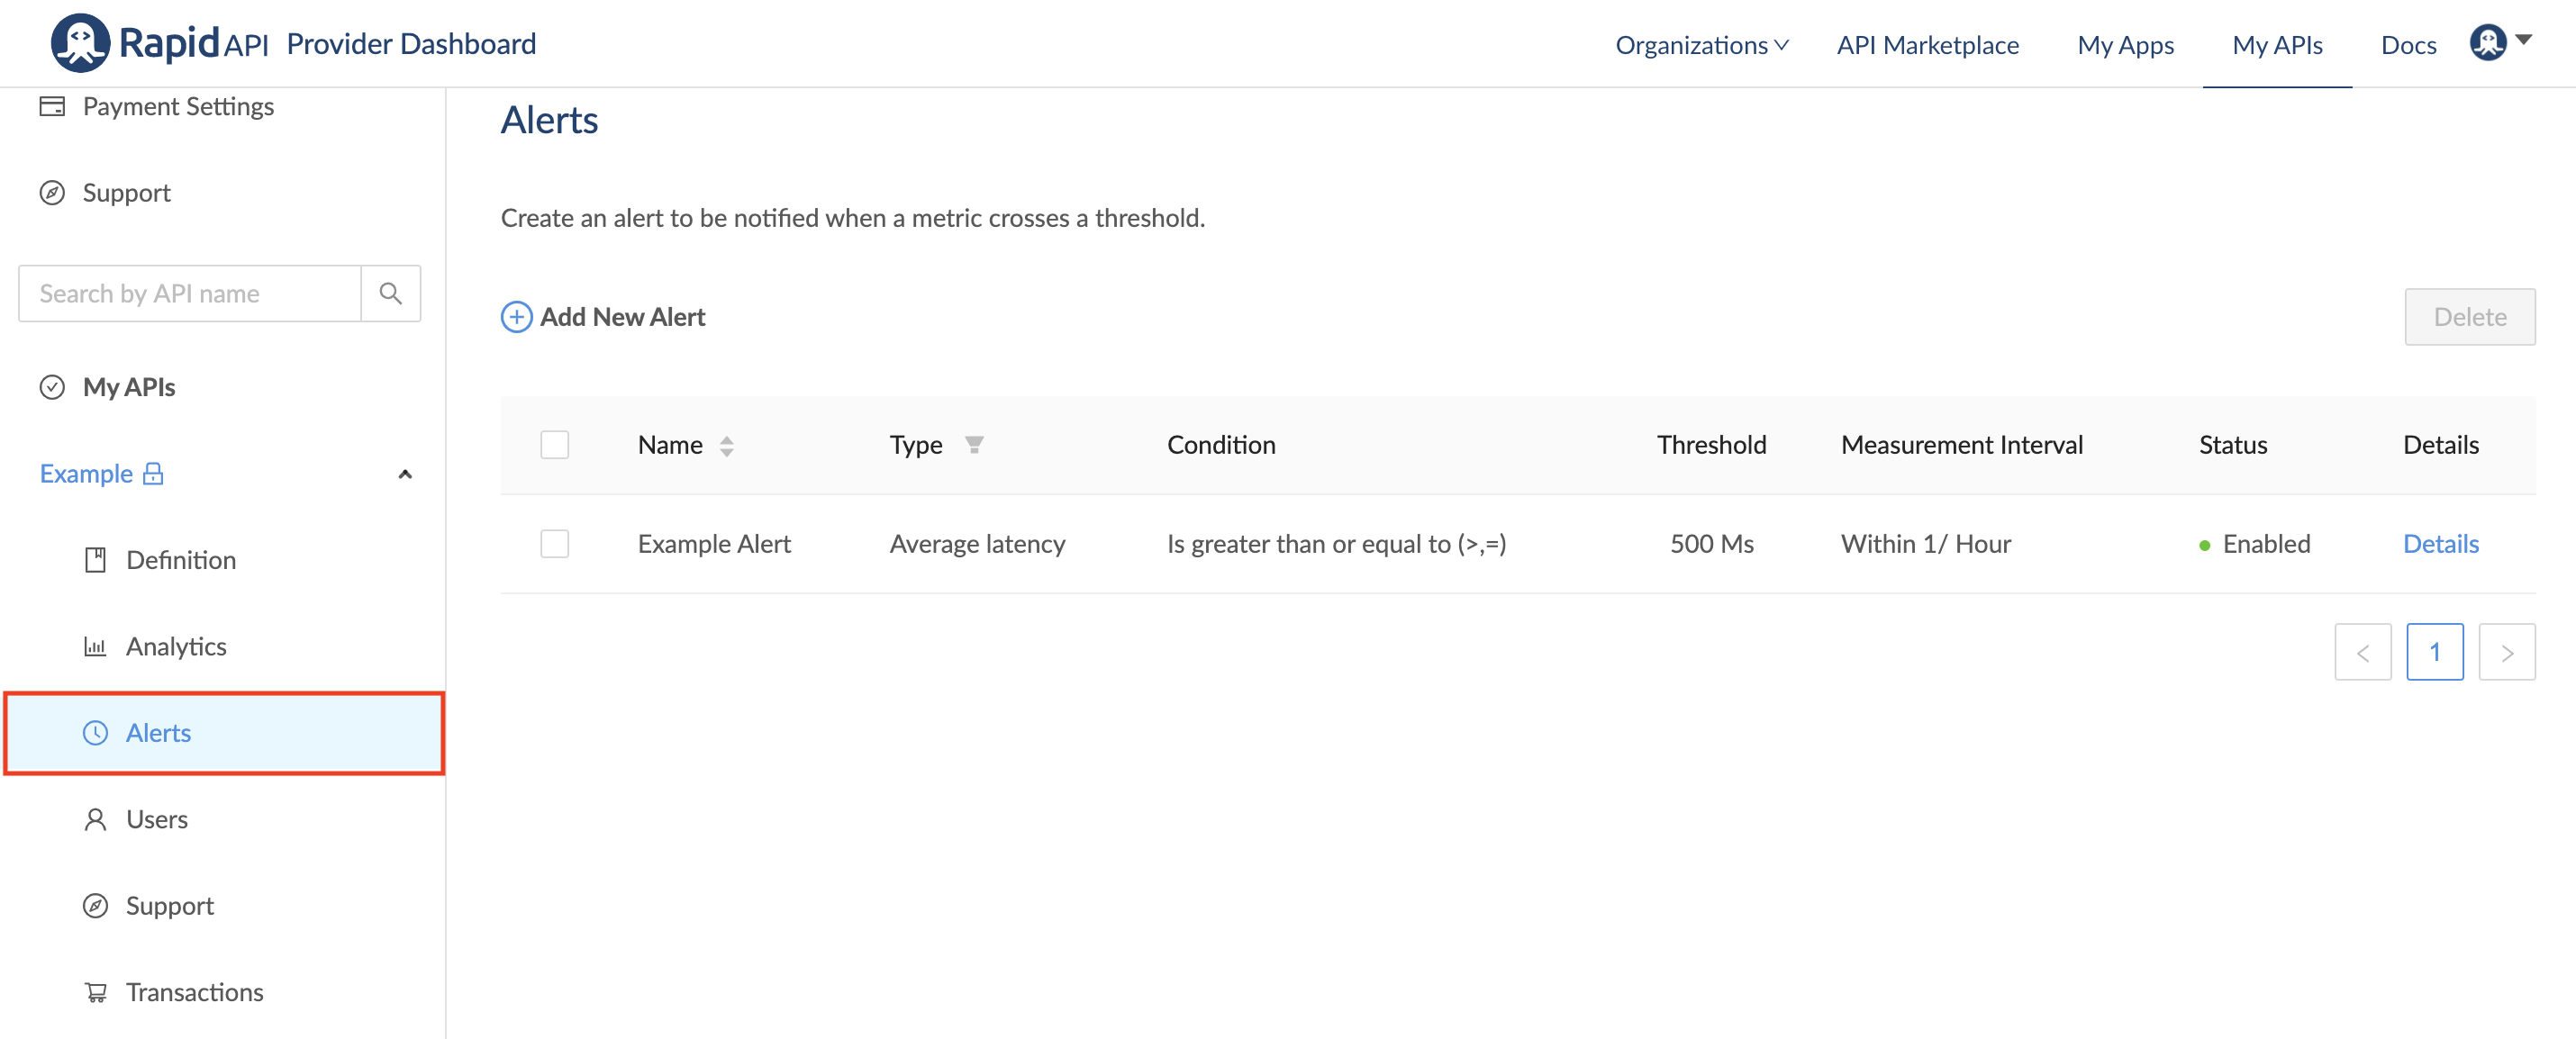
You can create custom alerts to notify you when a specified metric crosses a certain threshold. To get started, navigate to the Provider Dashboard, and select the Alerts tab for the desired API.

Alerts Use CasesAlerts can be configured for many reasons, including alerting you when the API does not function as expected or alerting you to a possible DDoS or other abuse of the API
Create a Custom Alert
There are a few simple steps to create a custom alert:
Step One: Navigate to the Alerts tab on the desired API and click the "Add New Alert" button.
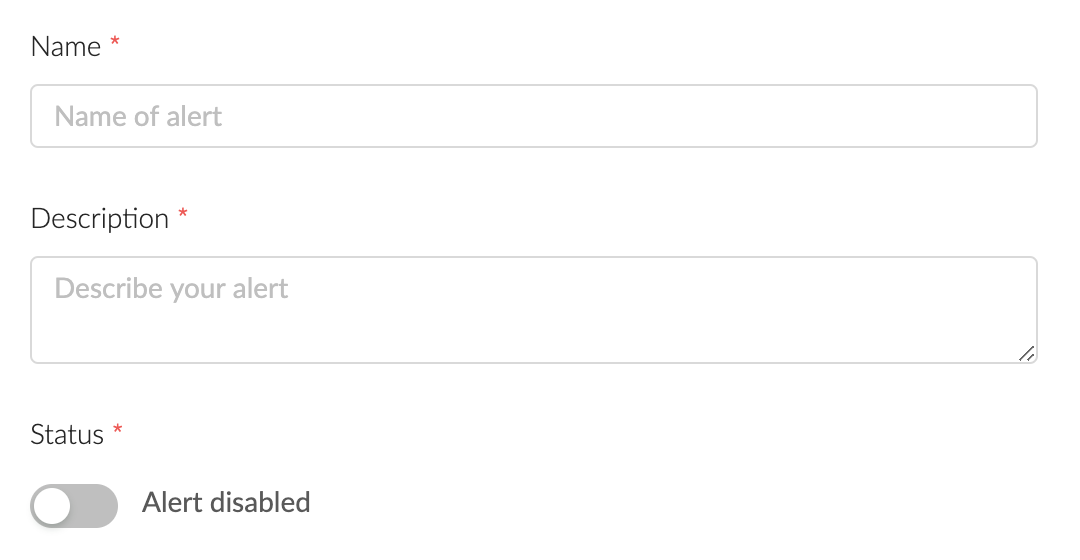
Step Two: Name and describe the alert. You can toggle the alert to be active or disabled.

Step Three: Define the metric you want to measure. You can choose from many metrics, including the total number of requests, total request size, total number of errors, average latency, average error rate, and more.
You can also specify the scope of the alert by choosing a specific endpoint from the dropdown.

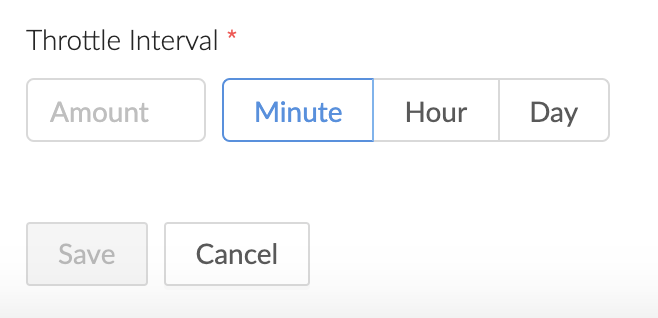
Step 4: Select the minimum time interval between two alerts. This prevents you from receiving many alerts related to the same event (ex: latency frequently fluctuating above and below the specified cutoff)

Step 5: Save the alert
How to Edit an Existing Alert
To edit an existing alert, click the "Details" link on the right side on the alert.

You can then edit or disable the alert as desired.
Updated 10 months ago