API Analytics
How to view and filter your API analytics
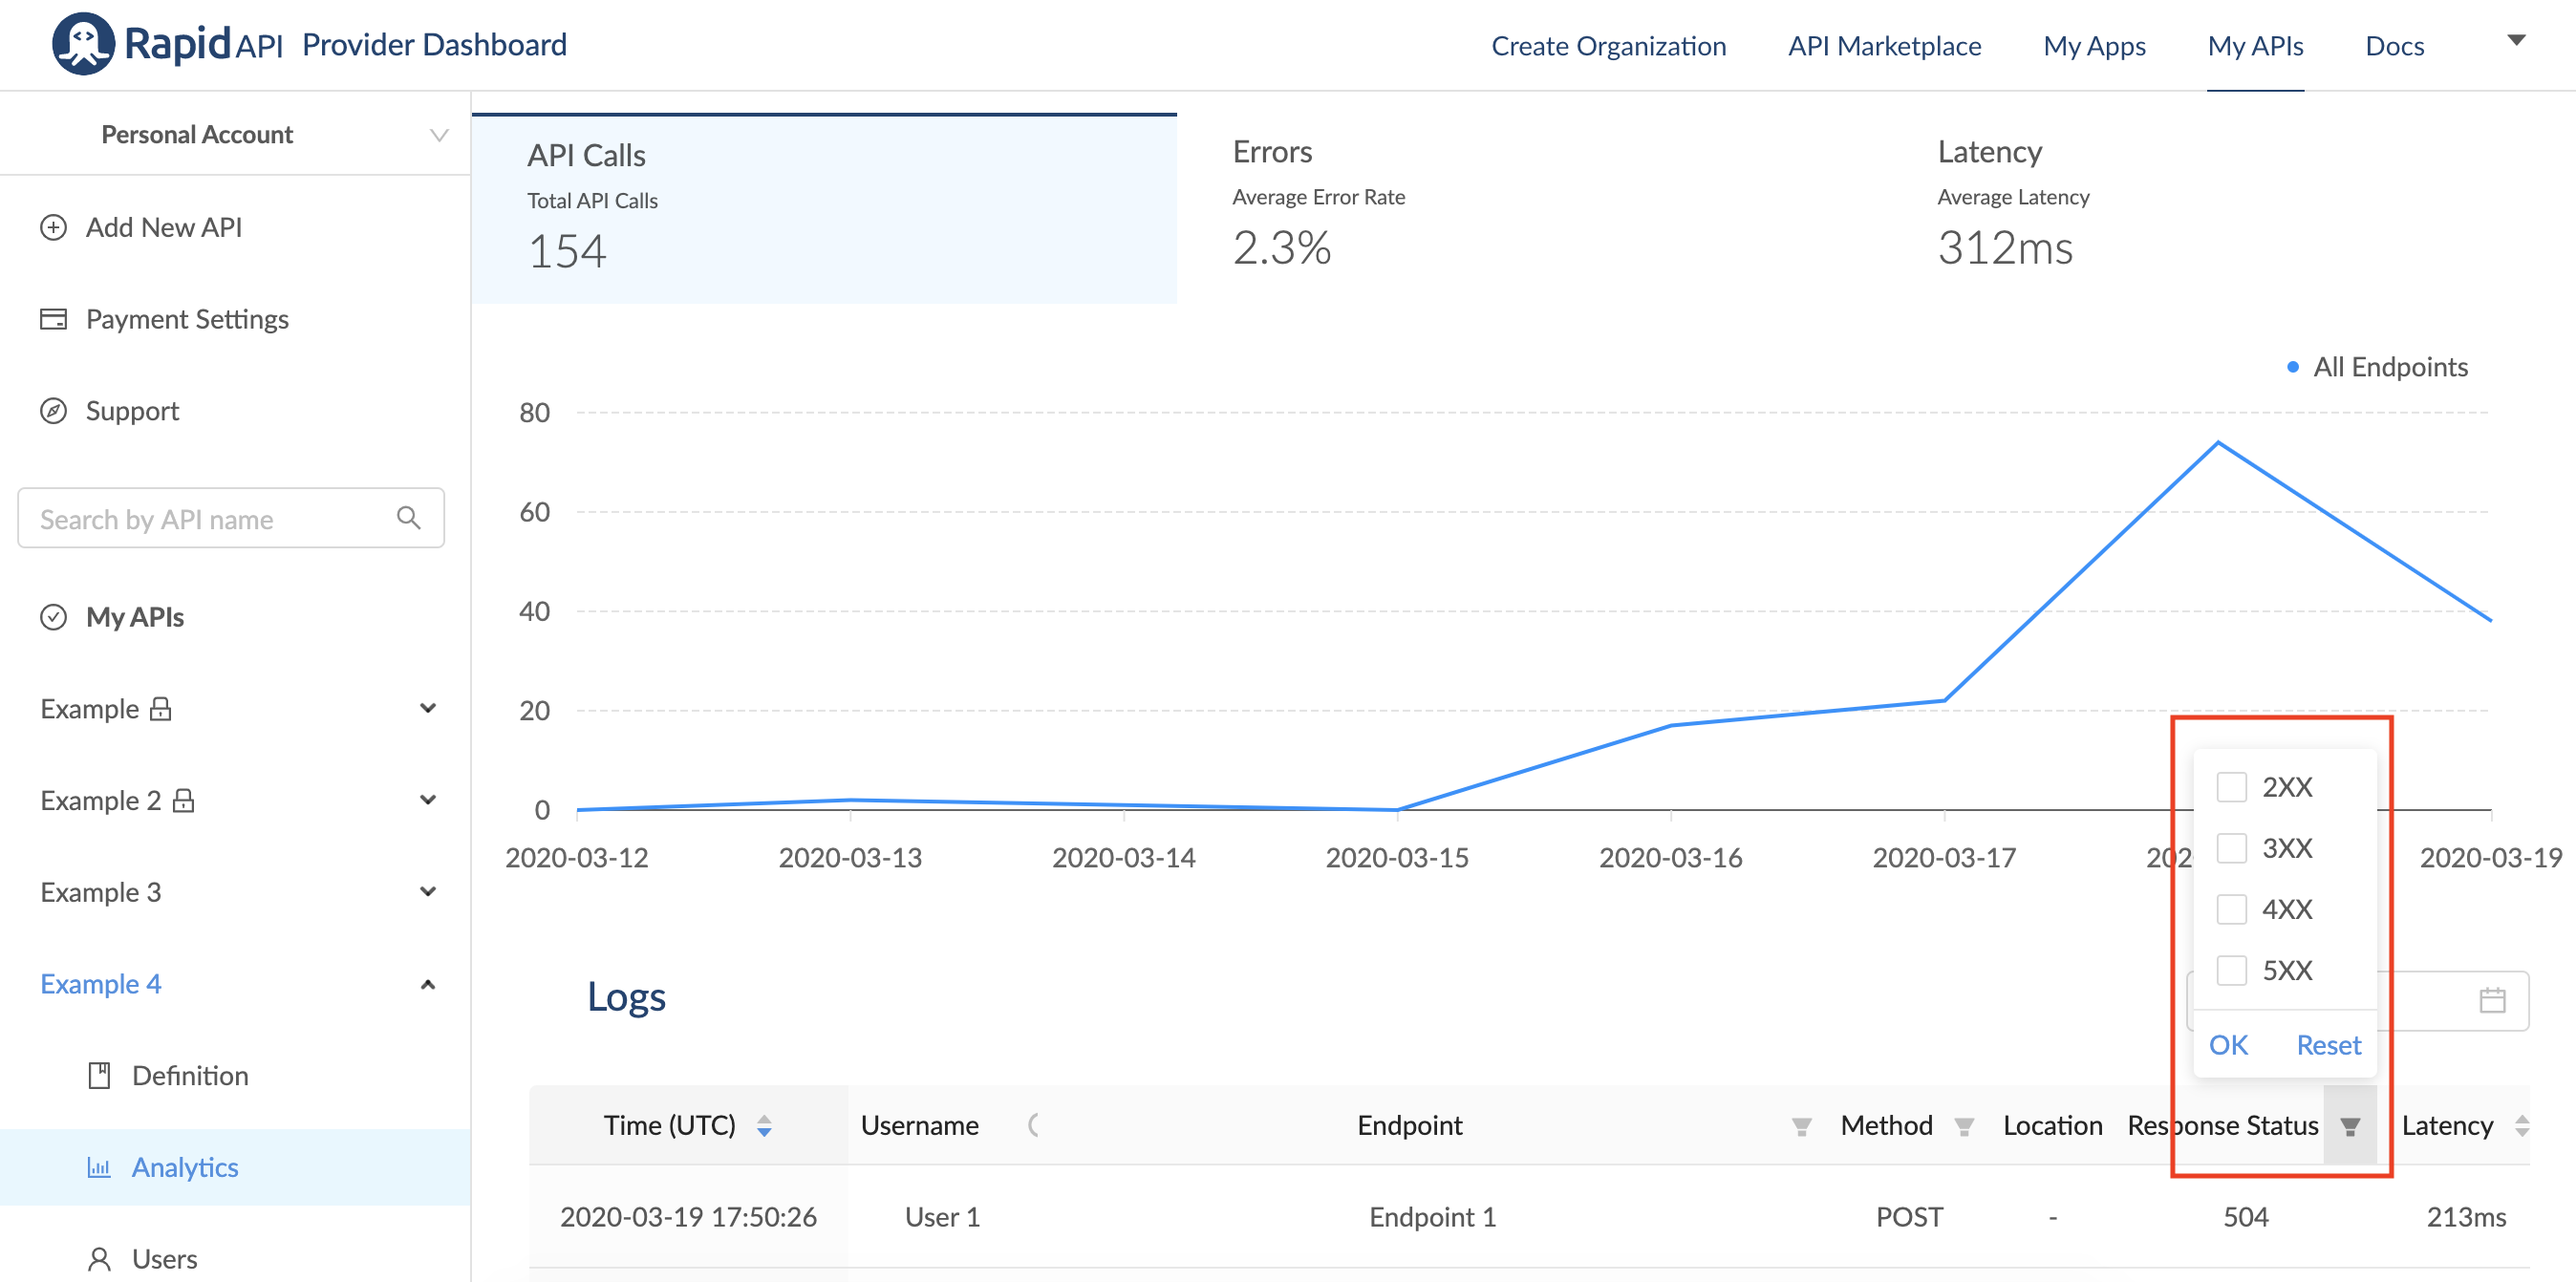
You can view analytics for your API from the Analytics tab of your API. You can view a graph for API calls, error rates, or latency. For example, the graph below shows API Calls so the API Calls section is highlighted in blue. You can click on "Errors" or "Latency" to switch views.
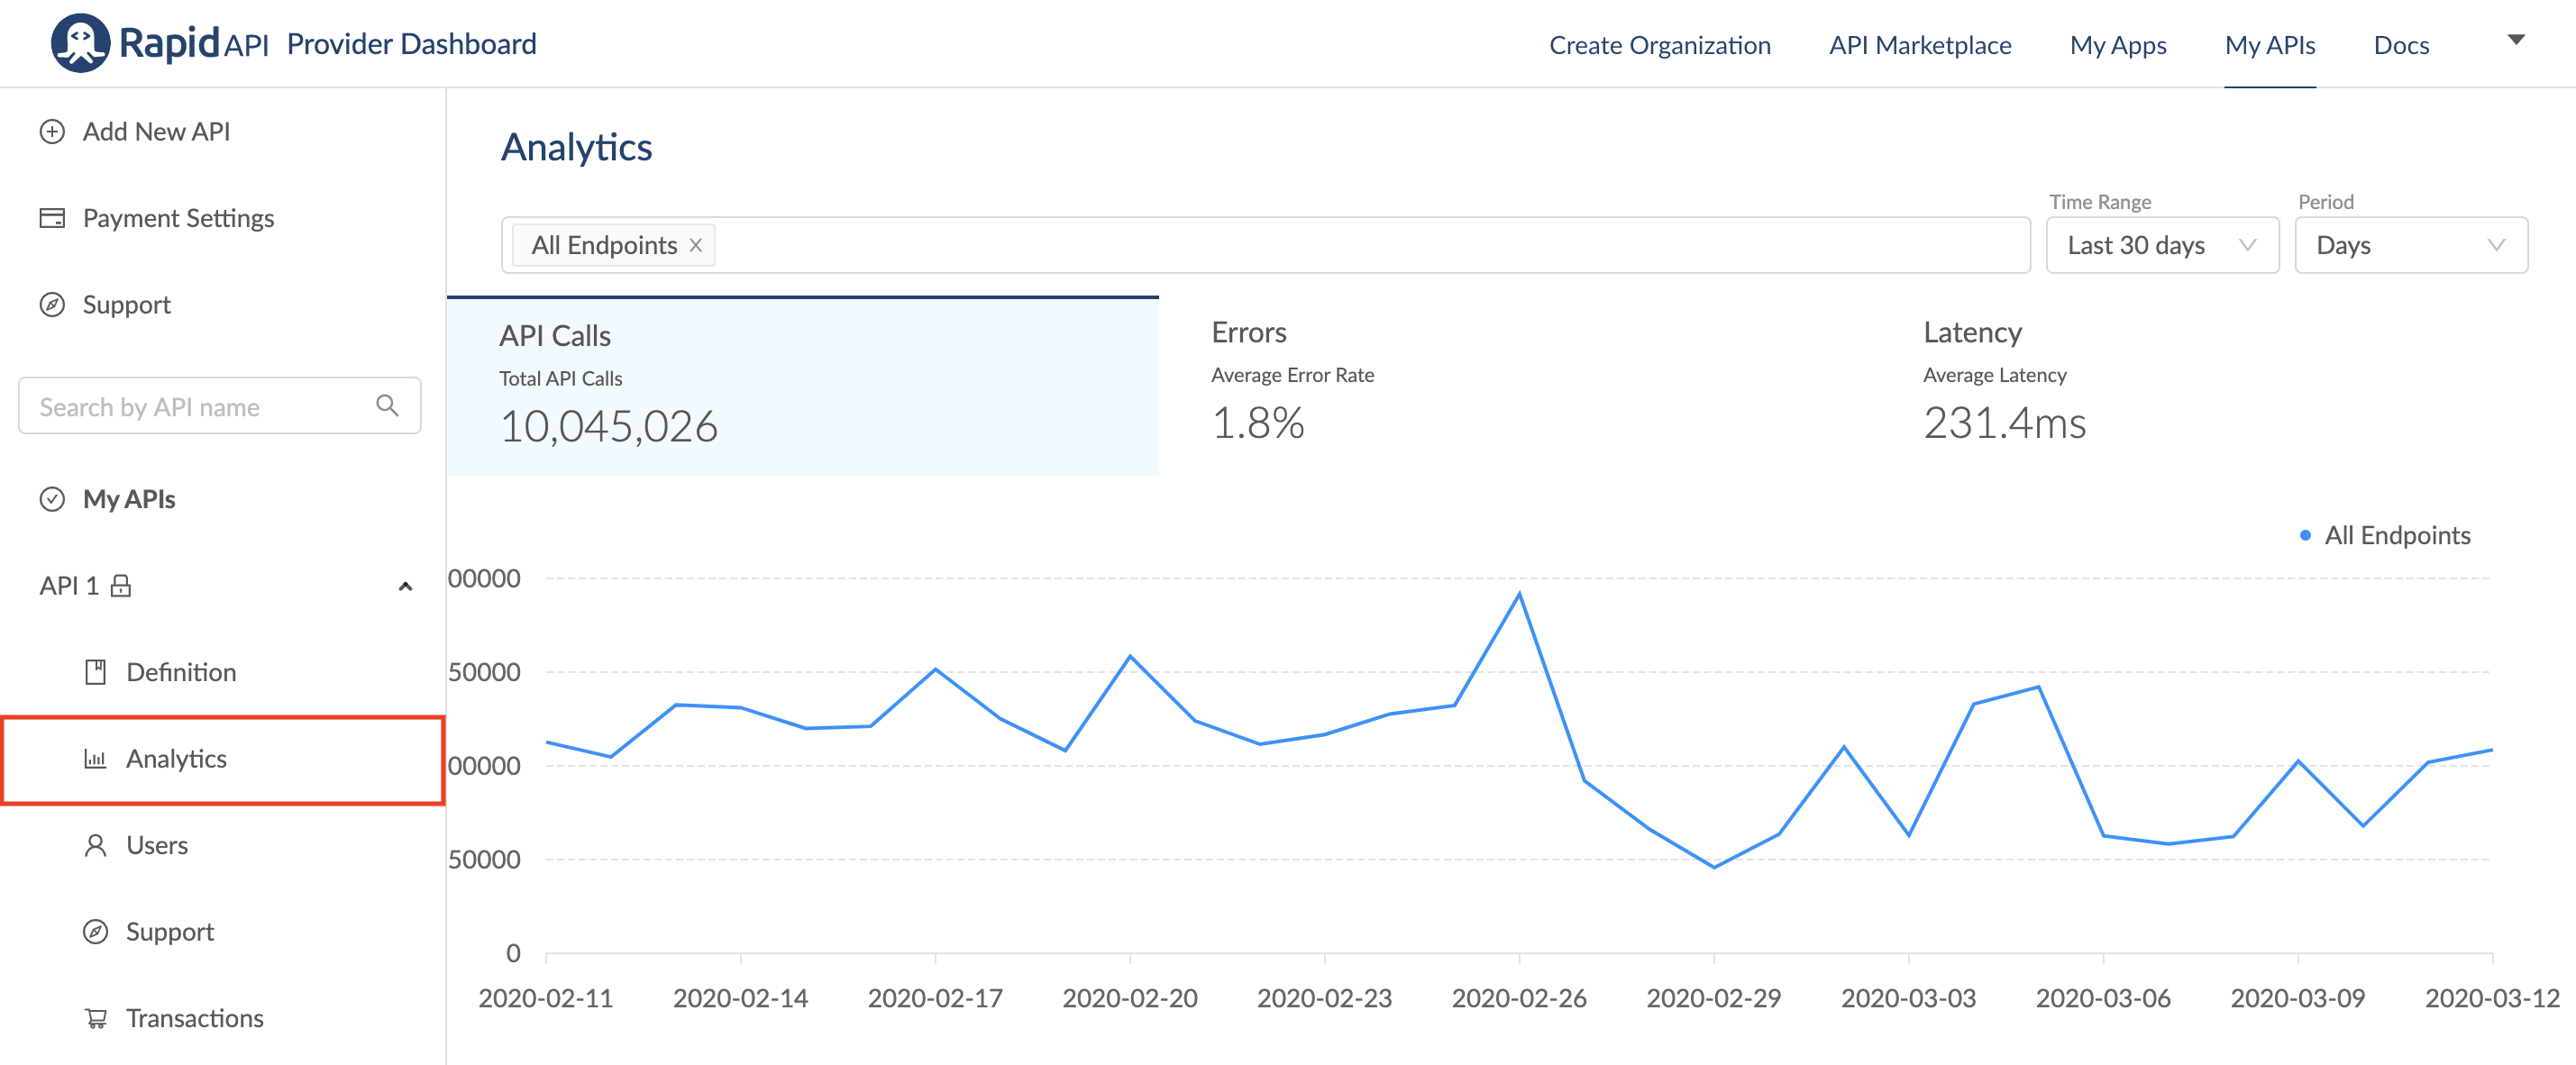
You can also adjust the timeline and granularity of the graph by using the Time Range and Period dropdowns.

Filter Analytics Graph by Endpoint
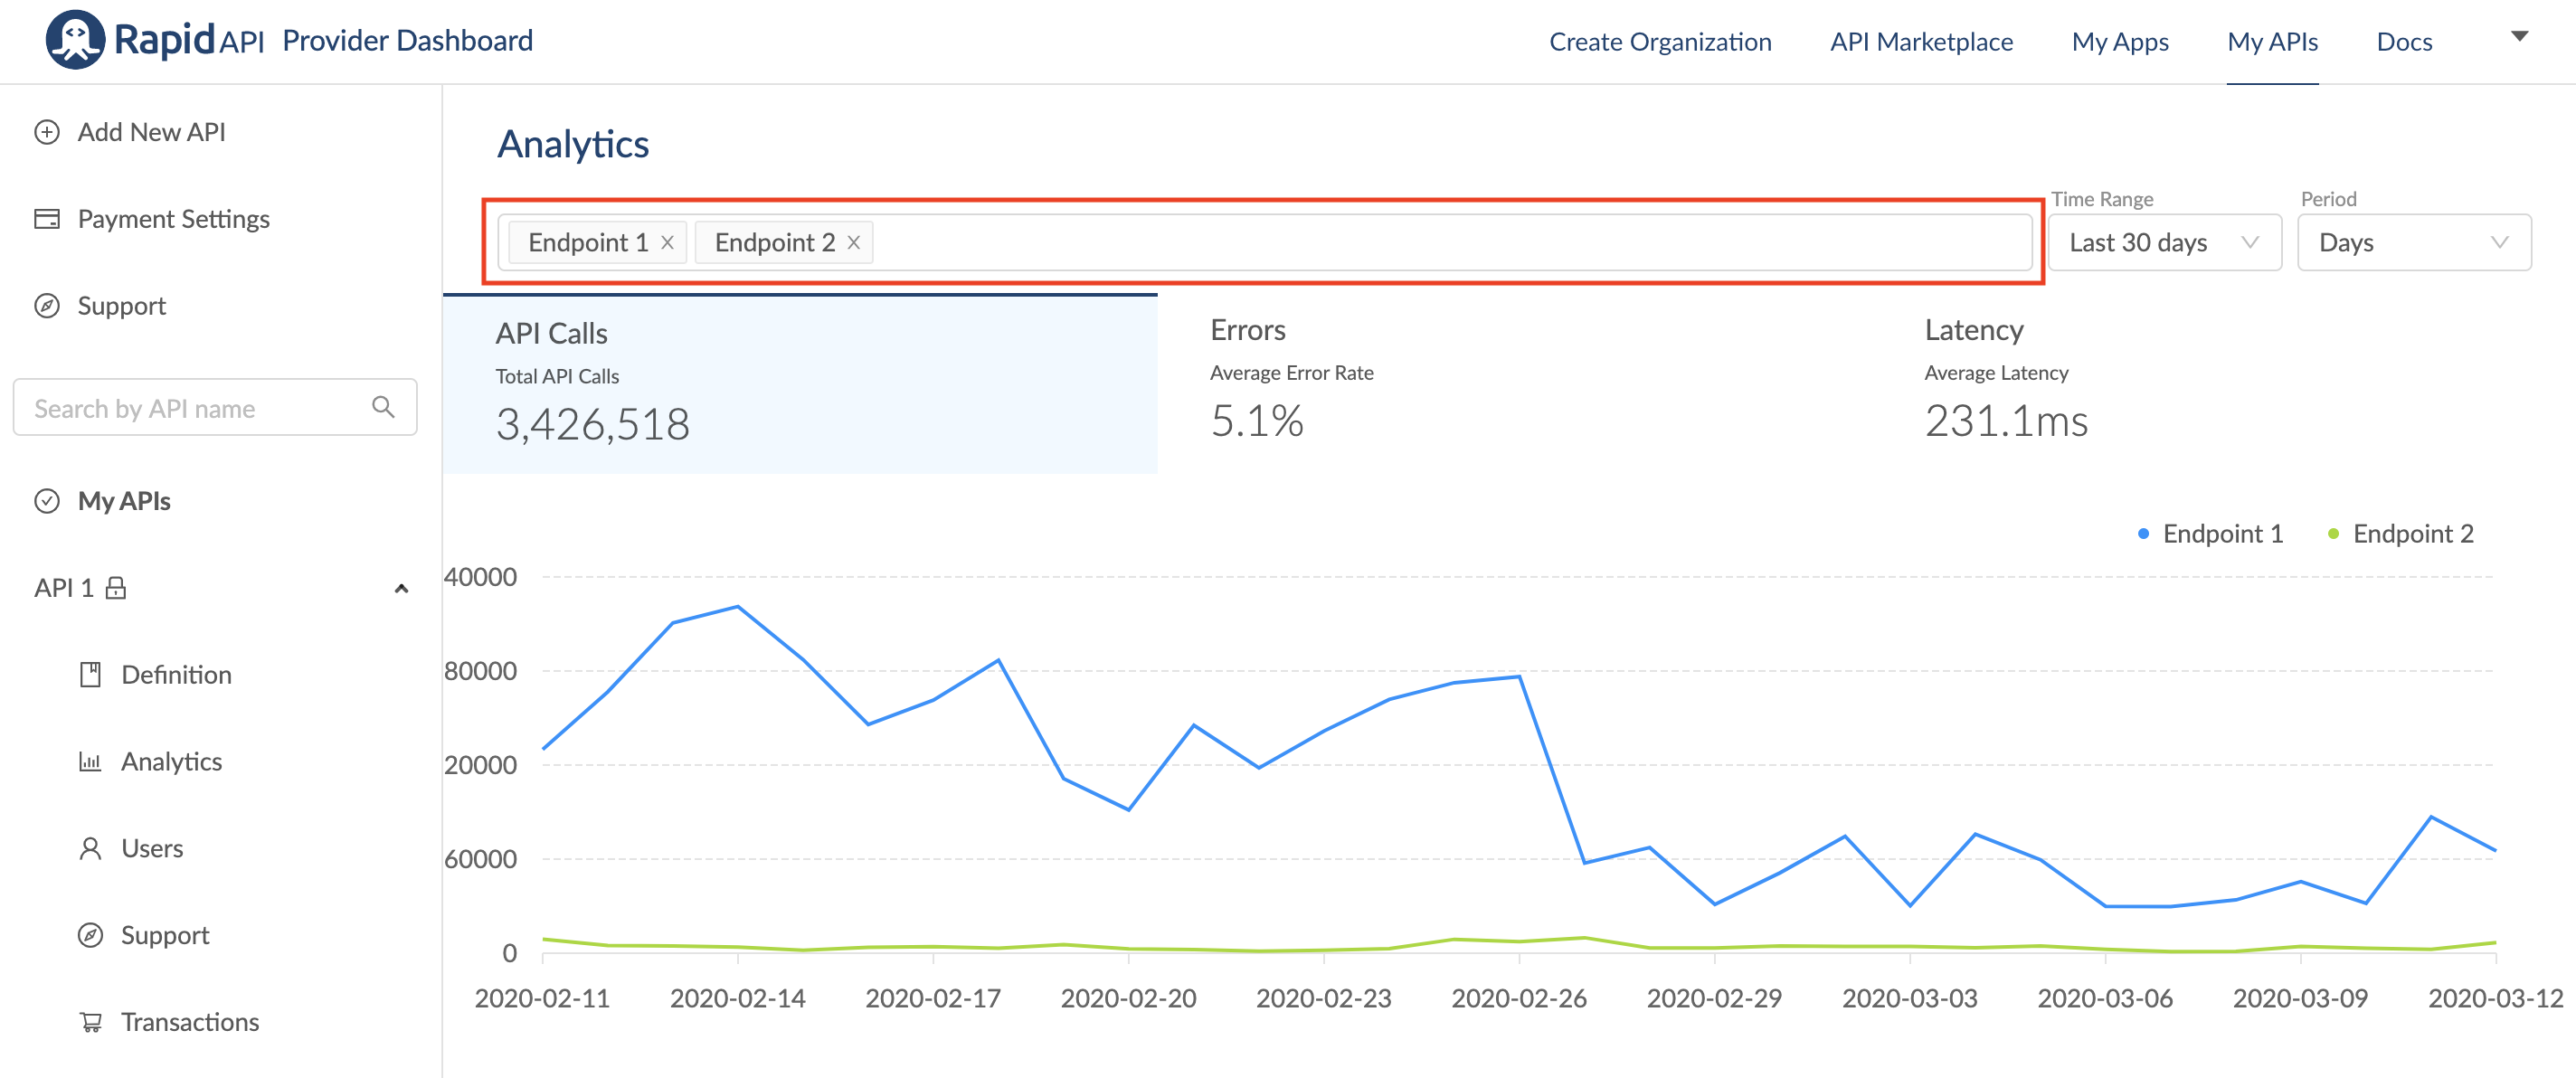
The default view shows analytics based on all of your endpoints. However, it is also possible to filter by one specific endpoint or multiple specific endpoints. Click the bar above the graph to see the available endpoints. Click the ones you want to be displayed in the graph.
Statistics and Calculations
API Calls
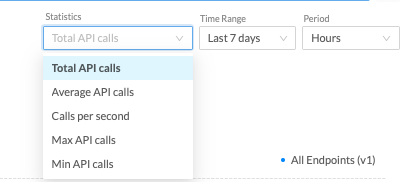
| Total API Calls | The total number of API calls in the selected time range | |
| Average API Calls | Average of the number of API calls in each period in the selected time range | Does not include periods with 0 calls |
| Calls Per Second | The total number of API calls in the selected time range divided by the number of seconds in the selected time range | |
| Max API Calls | Maximum of the number of API calls in each period in the selected time range | Does not include periods with 0 calls |
| Min API Calls | Minimum of the number of API calls in each period in the selected time range | Does not include periods with 0 calls |
Errors
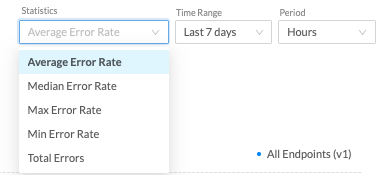
| Average Error Rate | The total number of errors divided by the total number of API calls in the selected time range | Does not include periods with 0 calls |
| Median Error Rate | Median of the total number of errors divided by the total number of API calls in each period in the selected time range | Does not include periods with 0 calls |
| Max Error Rate | Maximum of the total number of errors divided by the total number of API calls in each period in the selected time range | Does not include periods with 0 calls |
| Min Error Rate | Minimum of the total number of errors divided by the total number of API calls in each period in the selected time range | Does not include periods with 0 calls |
| Total Errors | The total number of errors in the selected time range |
Latency
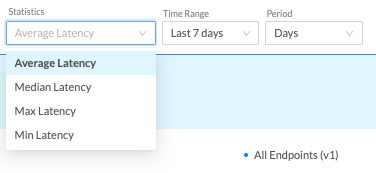
| Average Latency | Average of the latency of each call in the selected time range | Does not include periods with 0 calls |
| Median Latency | Median of the latency of each call in the selected time range | Does not include periods with 0 calls |
| Max Latency | Maximum of the latency of each call in the selected time range | Does not include periods with 0 calls |
| Min Latency | Minimum of the latency of each call in the selected time range | Does not include periods with 0 calls |
Logs
Below the graph, you can view logs that detail all of your app's API requests. Information in the log includes the time, username, endpoint, method, response status, latency, and more. You can filter and sort information using the filter icons.

For example, you can filter by endpoint, API, or response status. This can be useful if you are trying to troubleshoot a specific API or endpoint.
Updated 10 months ago