API Analytics
How to view and filter your API analytics
You can view analytics for your API from the Analytics tab of your API. You can view a graph for API calls, error rates, or latency. For example, the graph below shows API Calls so the API Calls section is highlighted in blue. You can click on "Errors" or "Latency" to switch views.
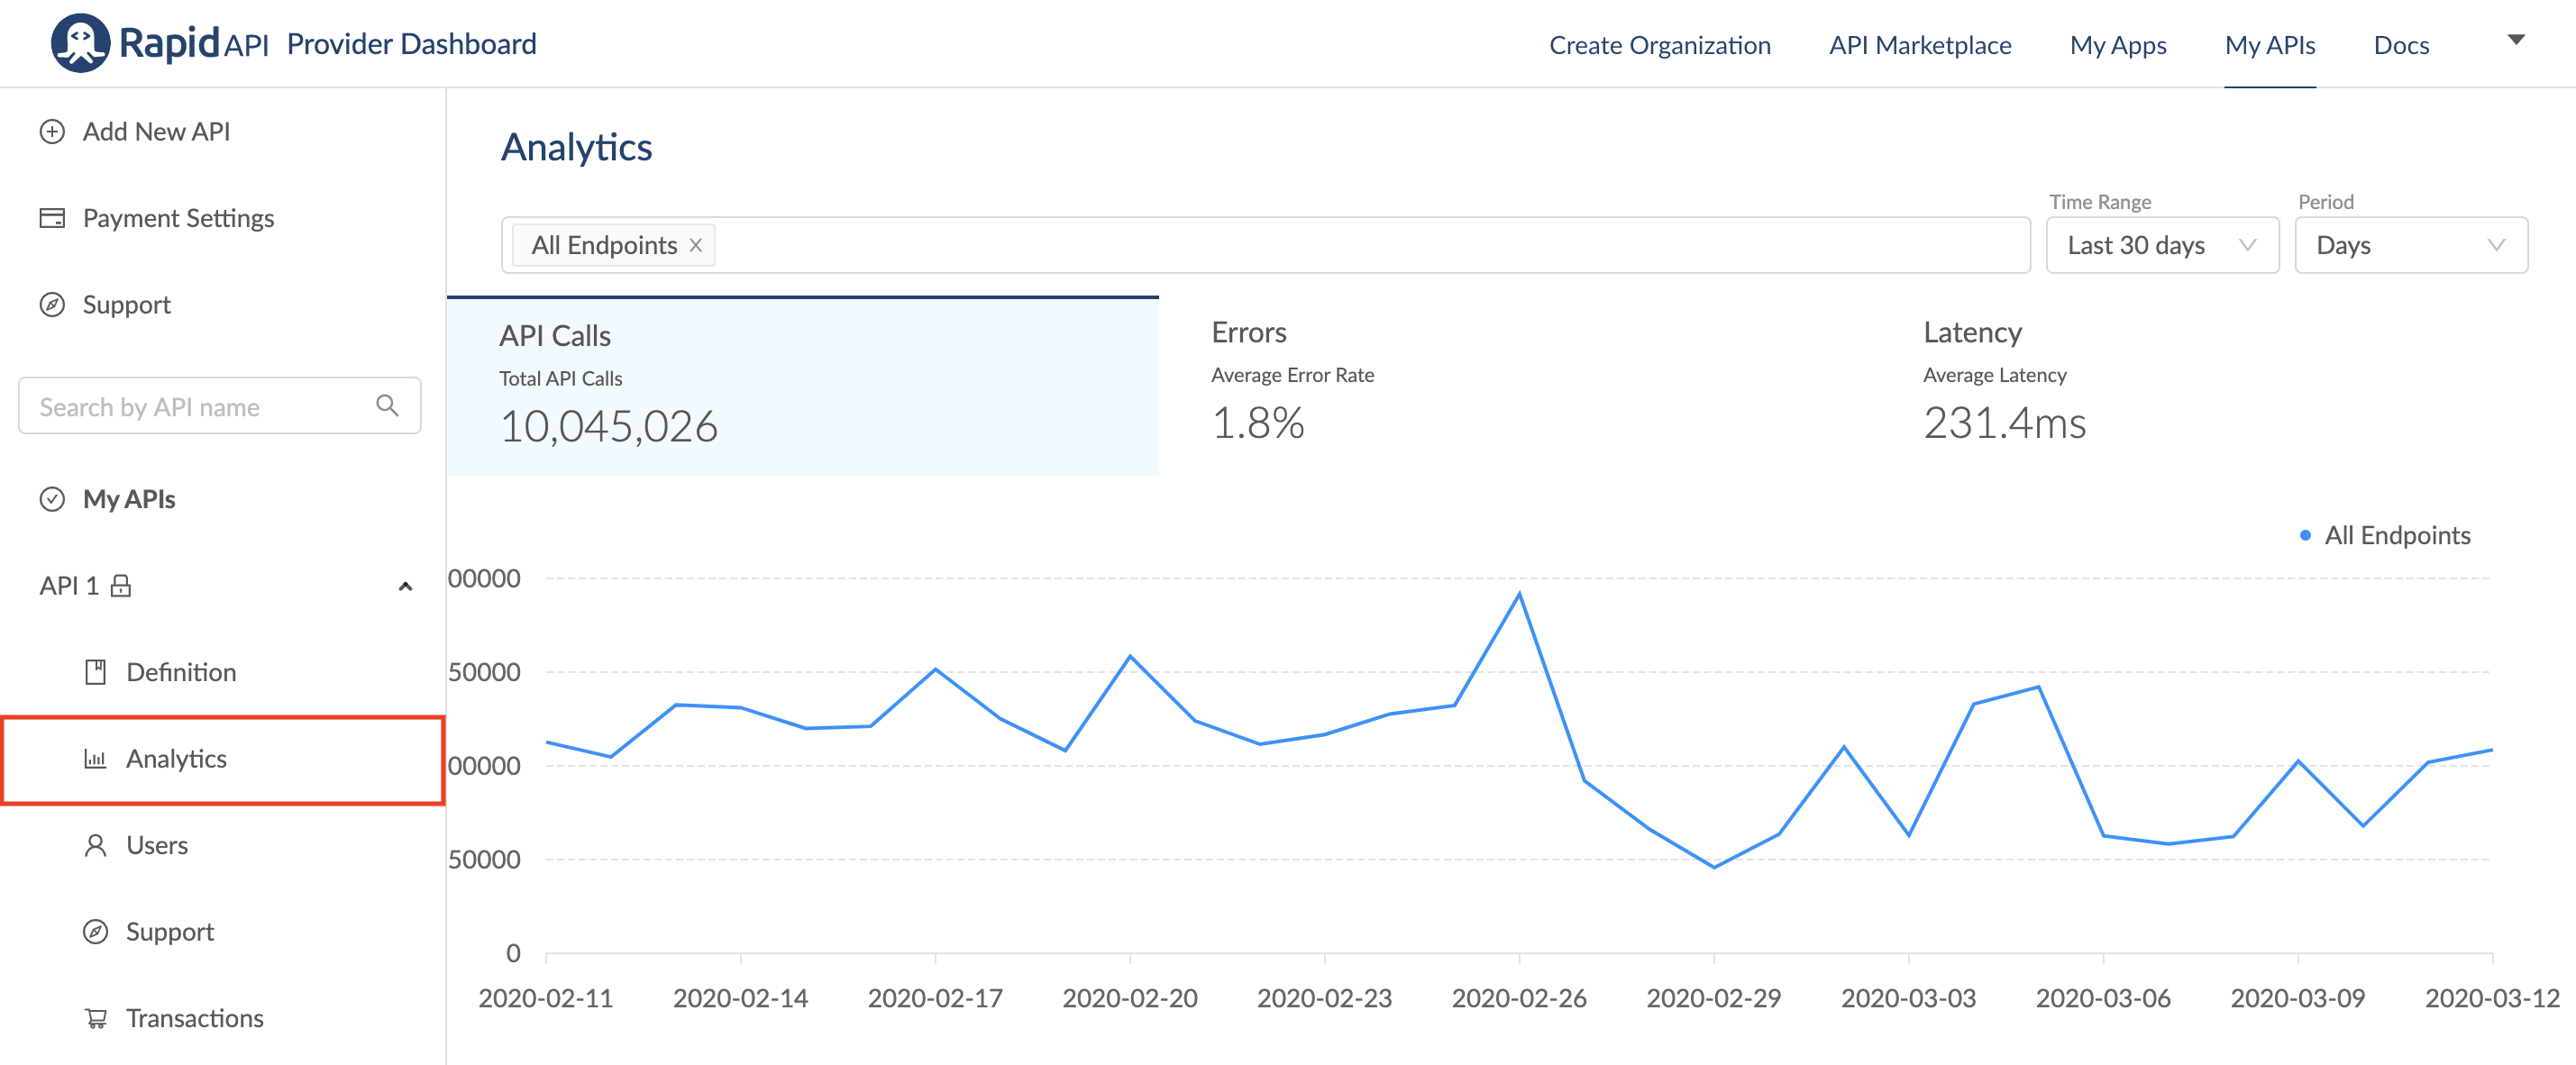
You can also adjust the timeline and granularity of the graph by using the Time Range and Period dropdowns.

Filter Analytics Graph by Endpoint
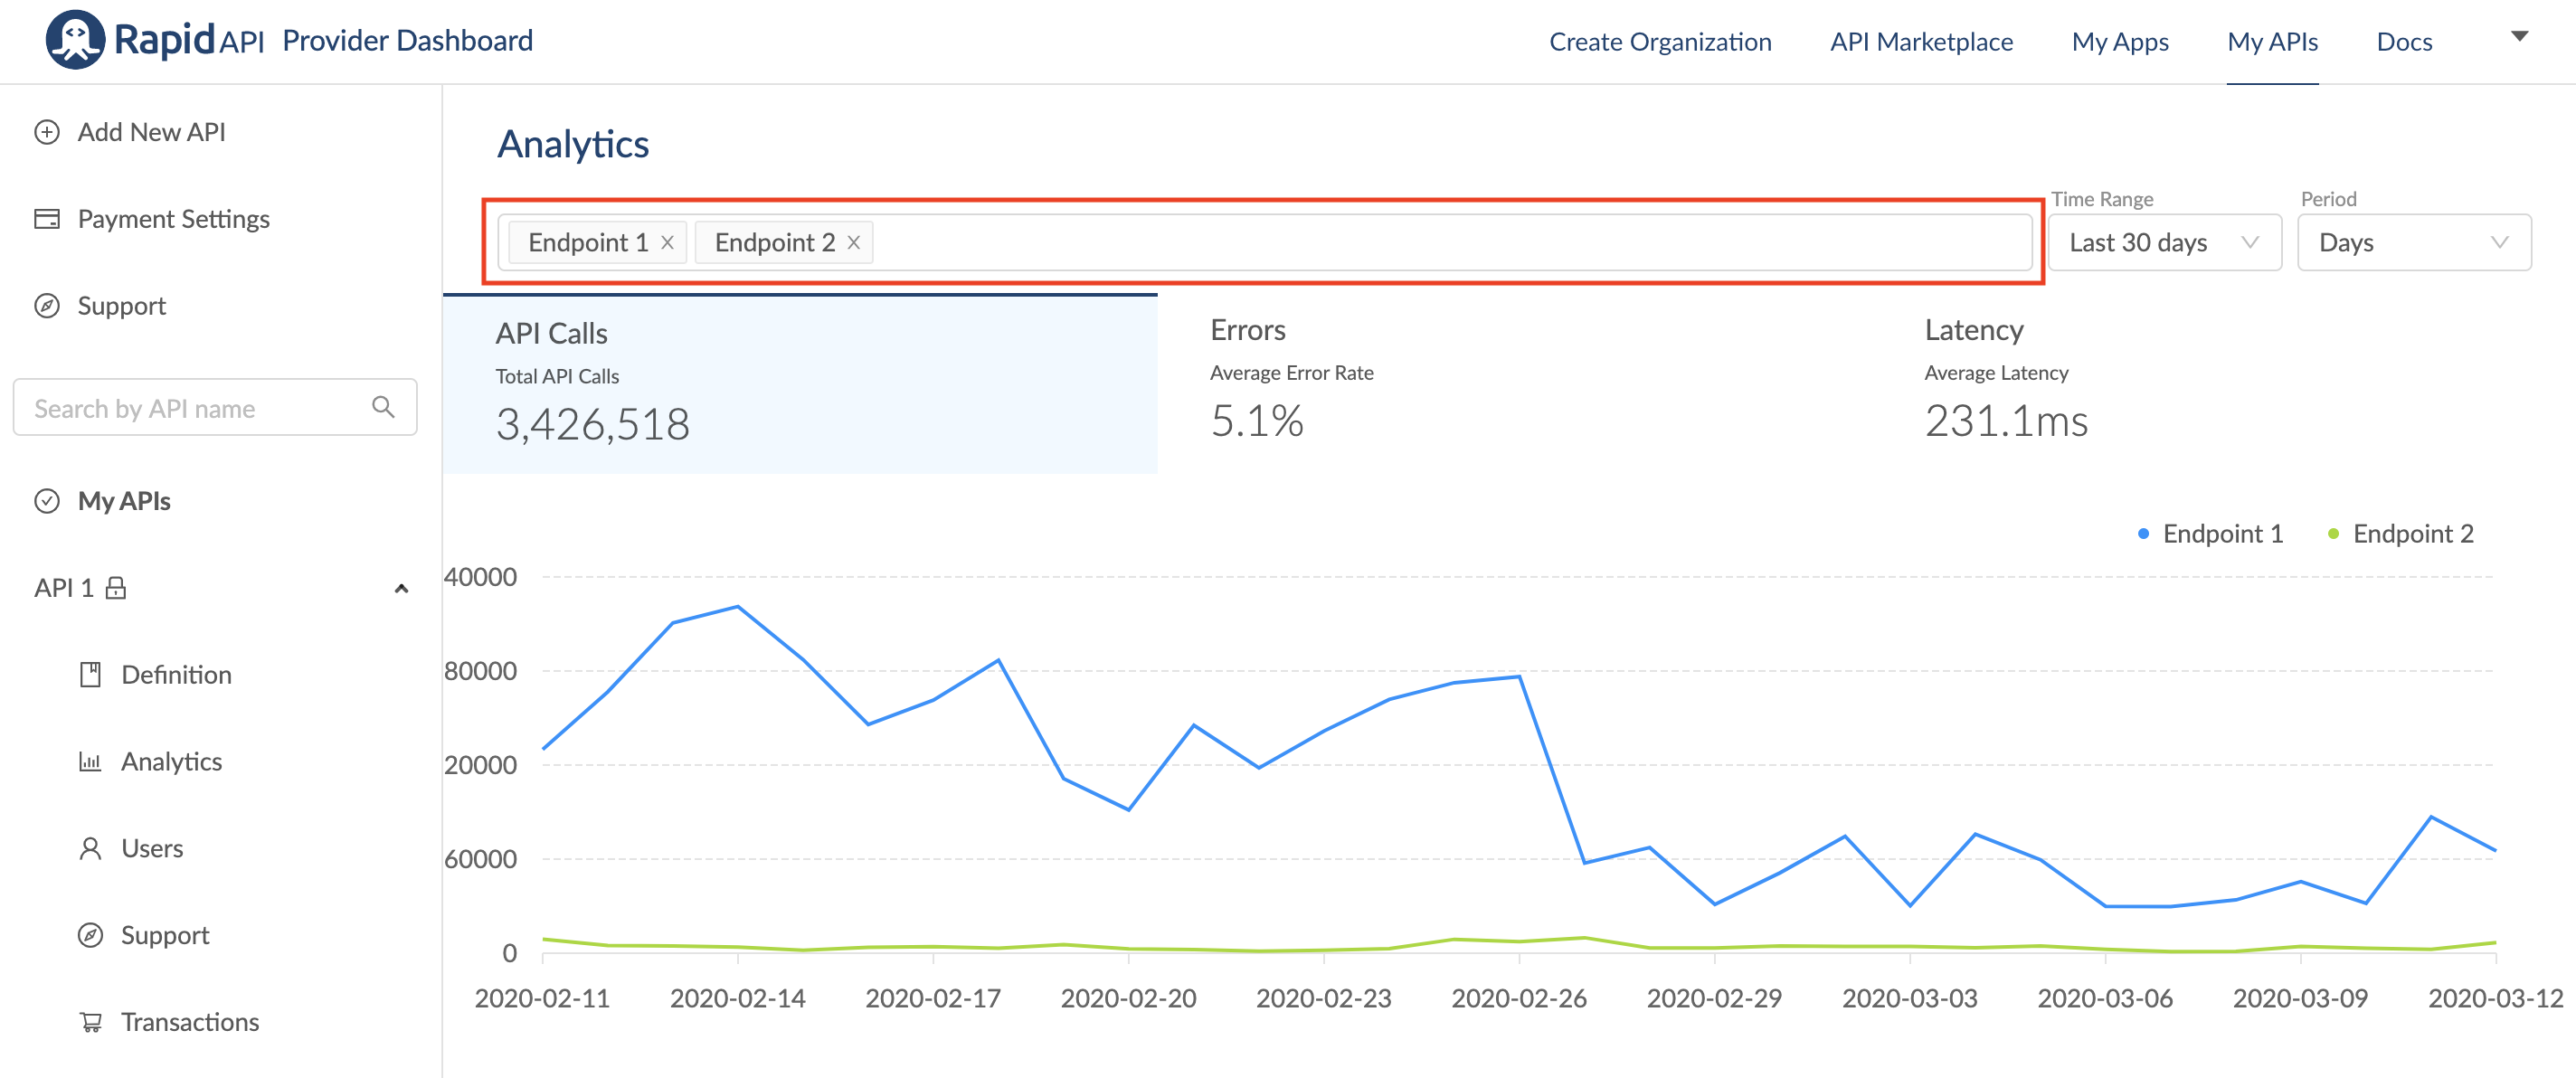
The default view shows analytics based on all of your endpoints. However, it is also possible to filter by one specific endpoint or multiple specific endpoints. Click the bar above the graph to see the available endpoints. Click the ones you want to be displayed in the graph.
Logs
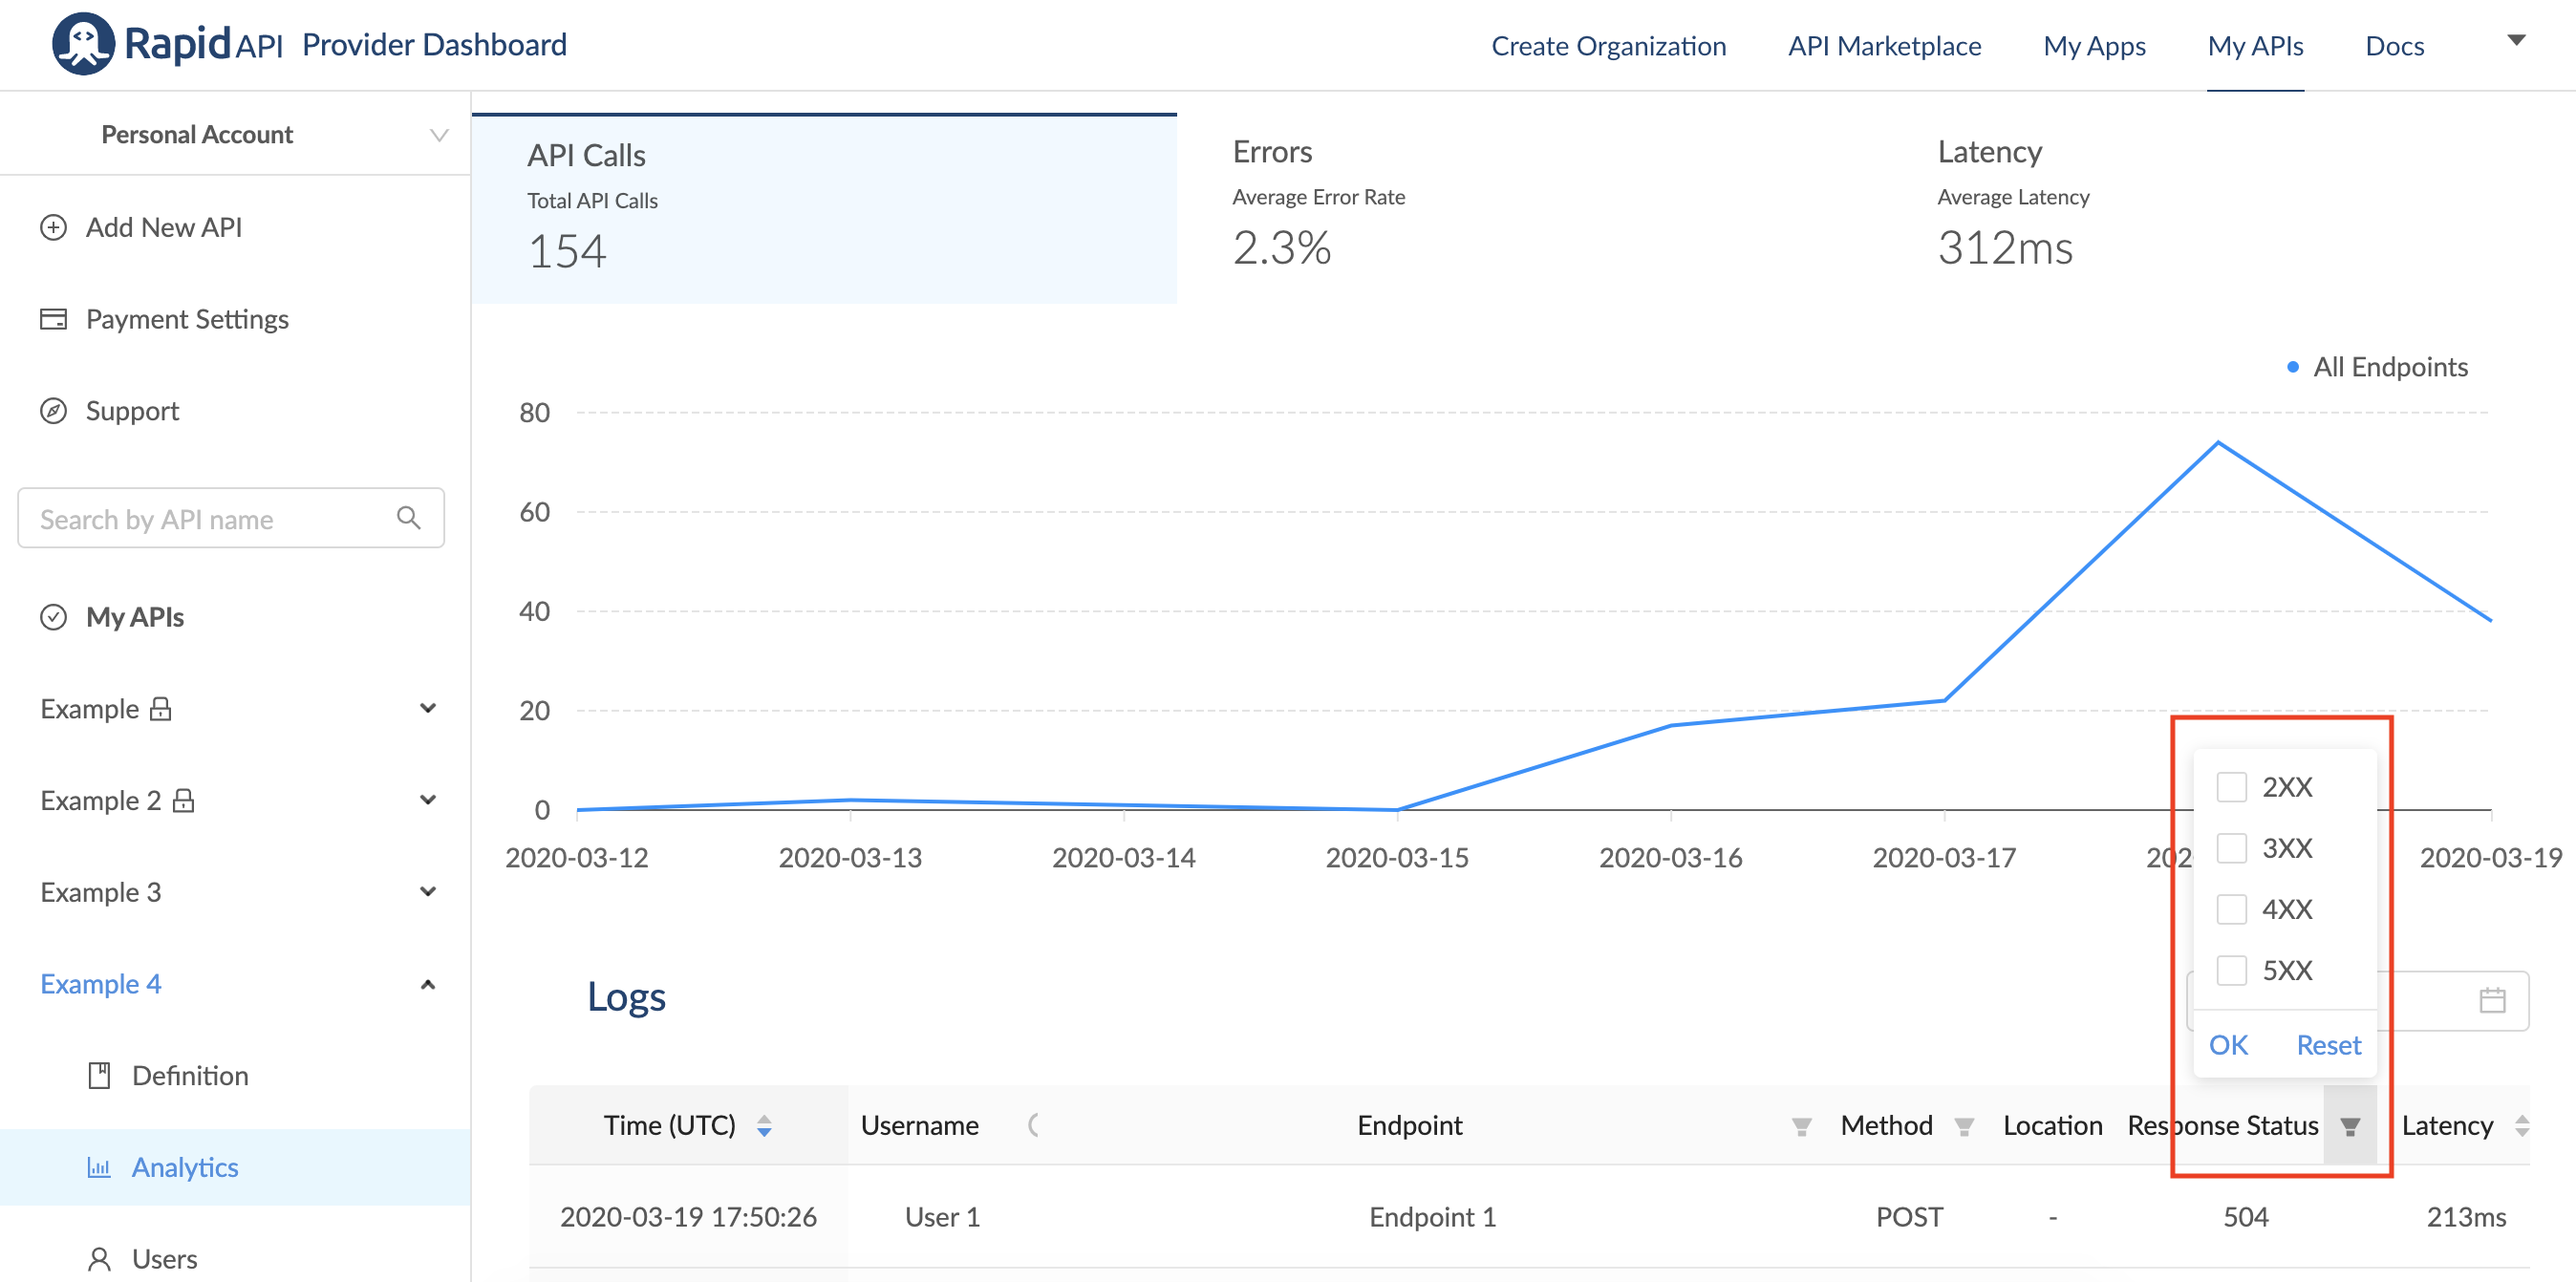
Below the graph, you can view logs that detail all of your app's API requests. Information in the log includes the time, username, endpoint, method, response status, latency, and more. You can filter and sort information using the filter icons.

For example, you can filter by endpoint, API, or response status. This can be useful if you are trying to troubleshoot a specific API or endpoint.
Export Logs
You can export your logs to a CSV file in a few steps.
1: Navigate to the Provider Dashboard and select the Analytics tab for the desired application.
2: Select the timeframe for the logs from the drop-down
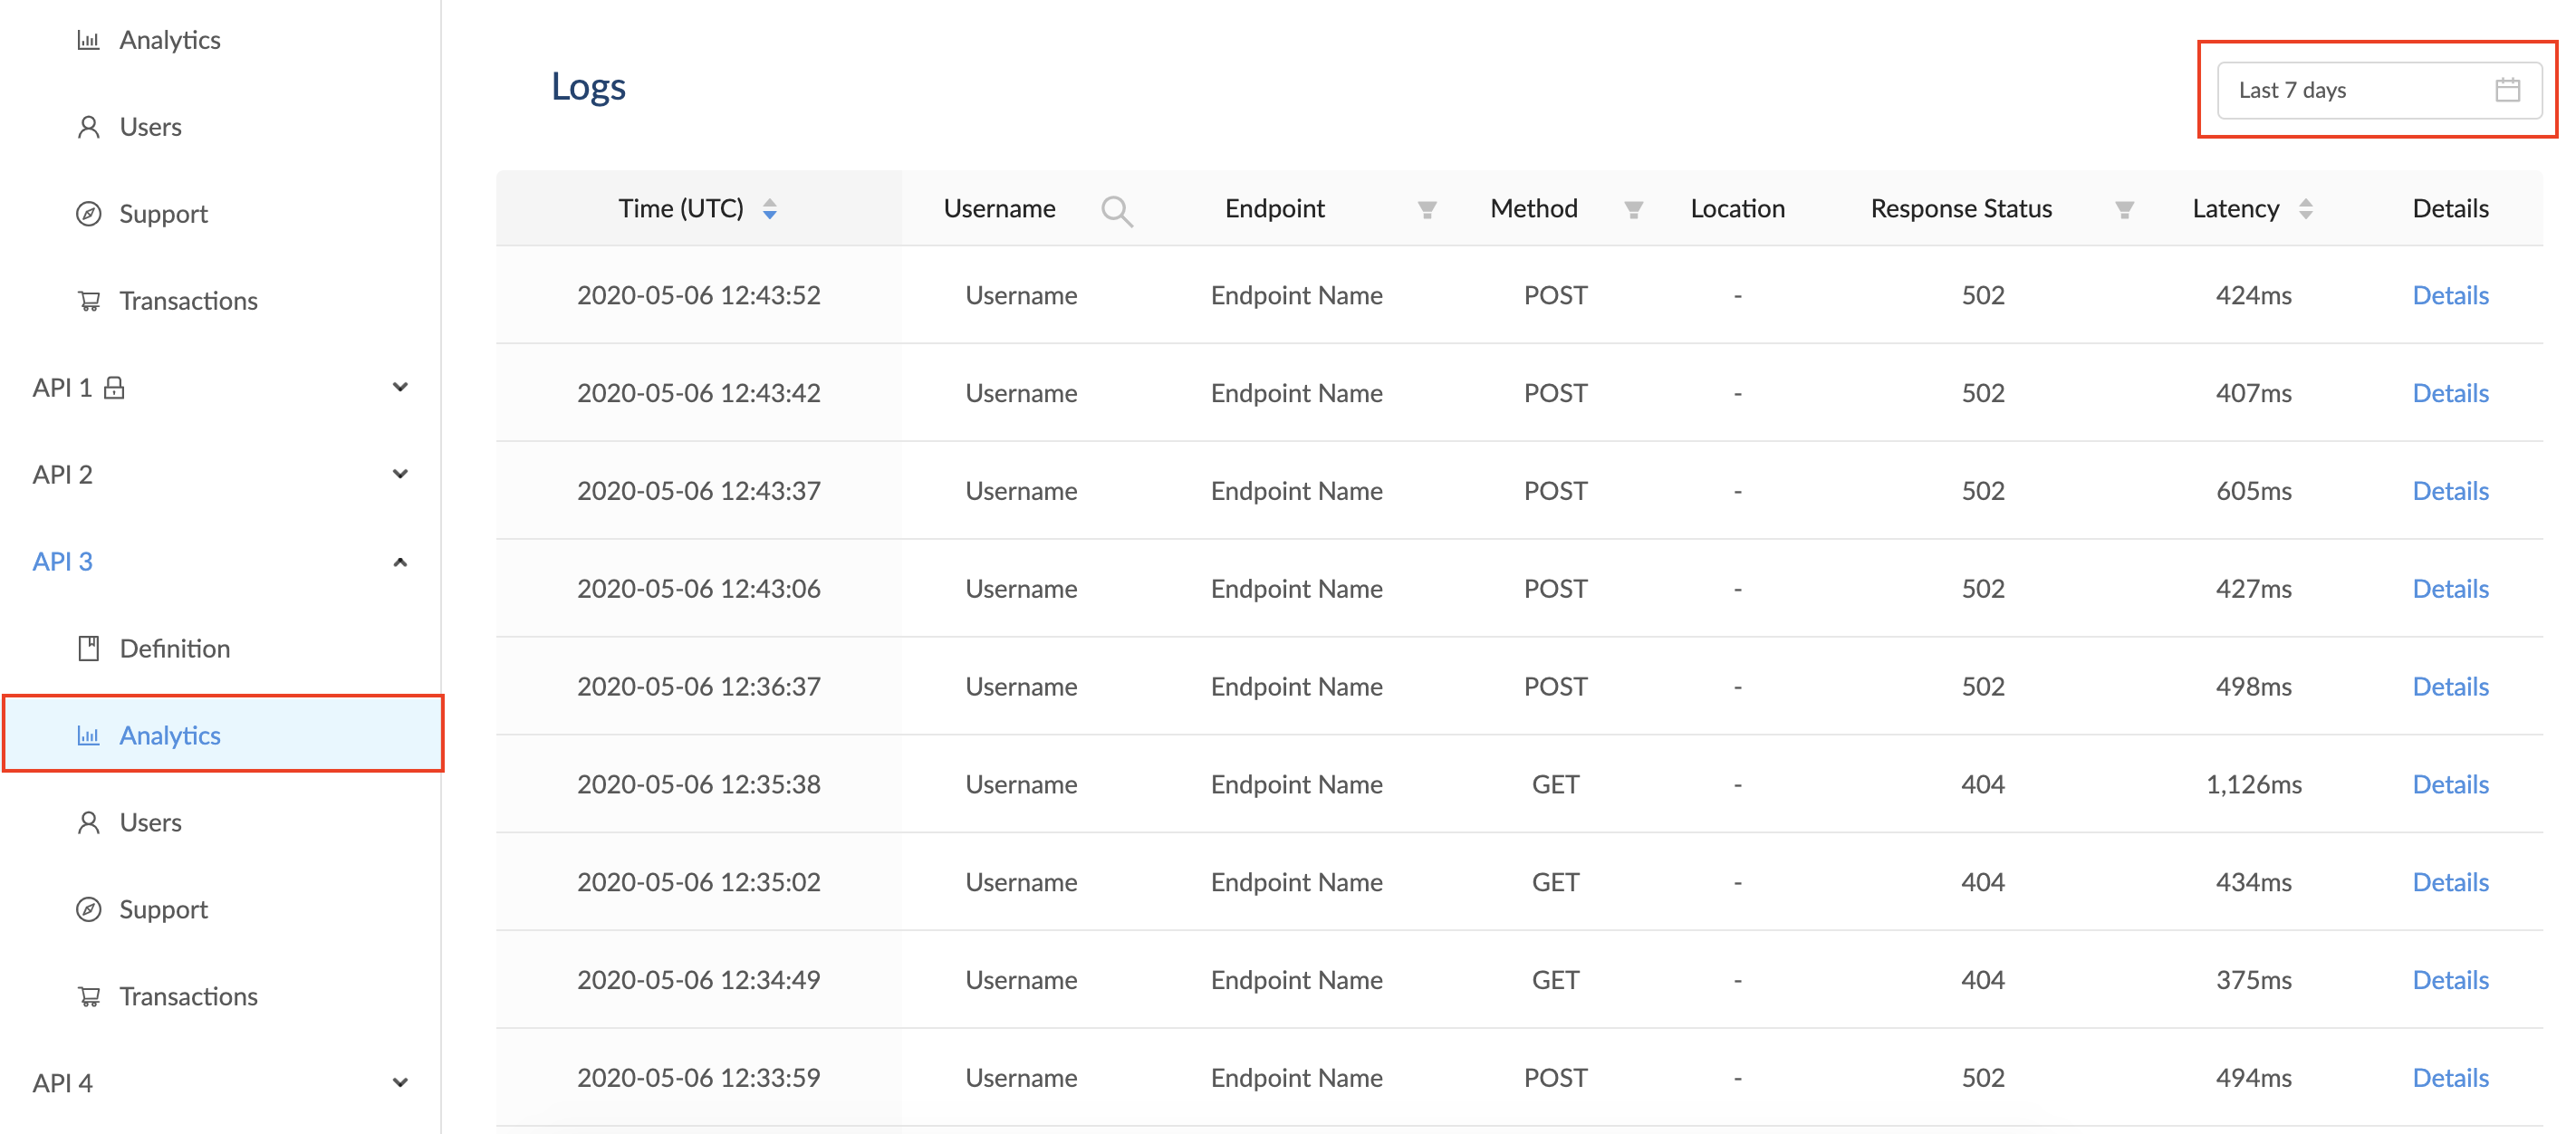
3: Click the "Export CSV" button
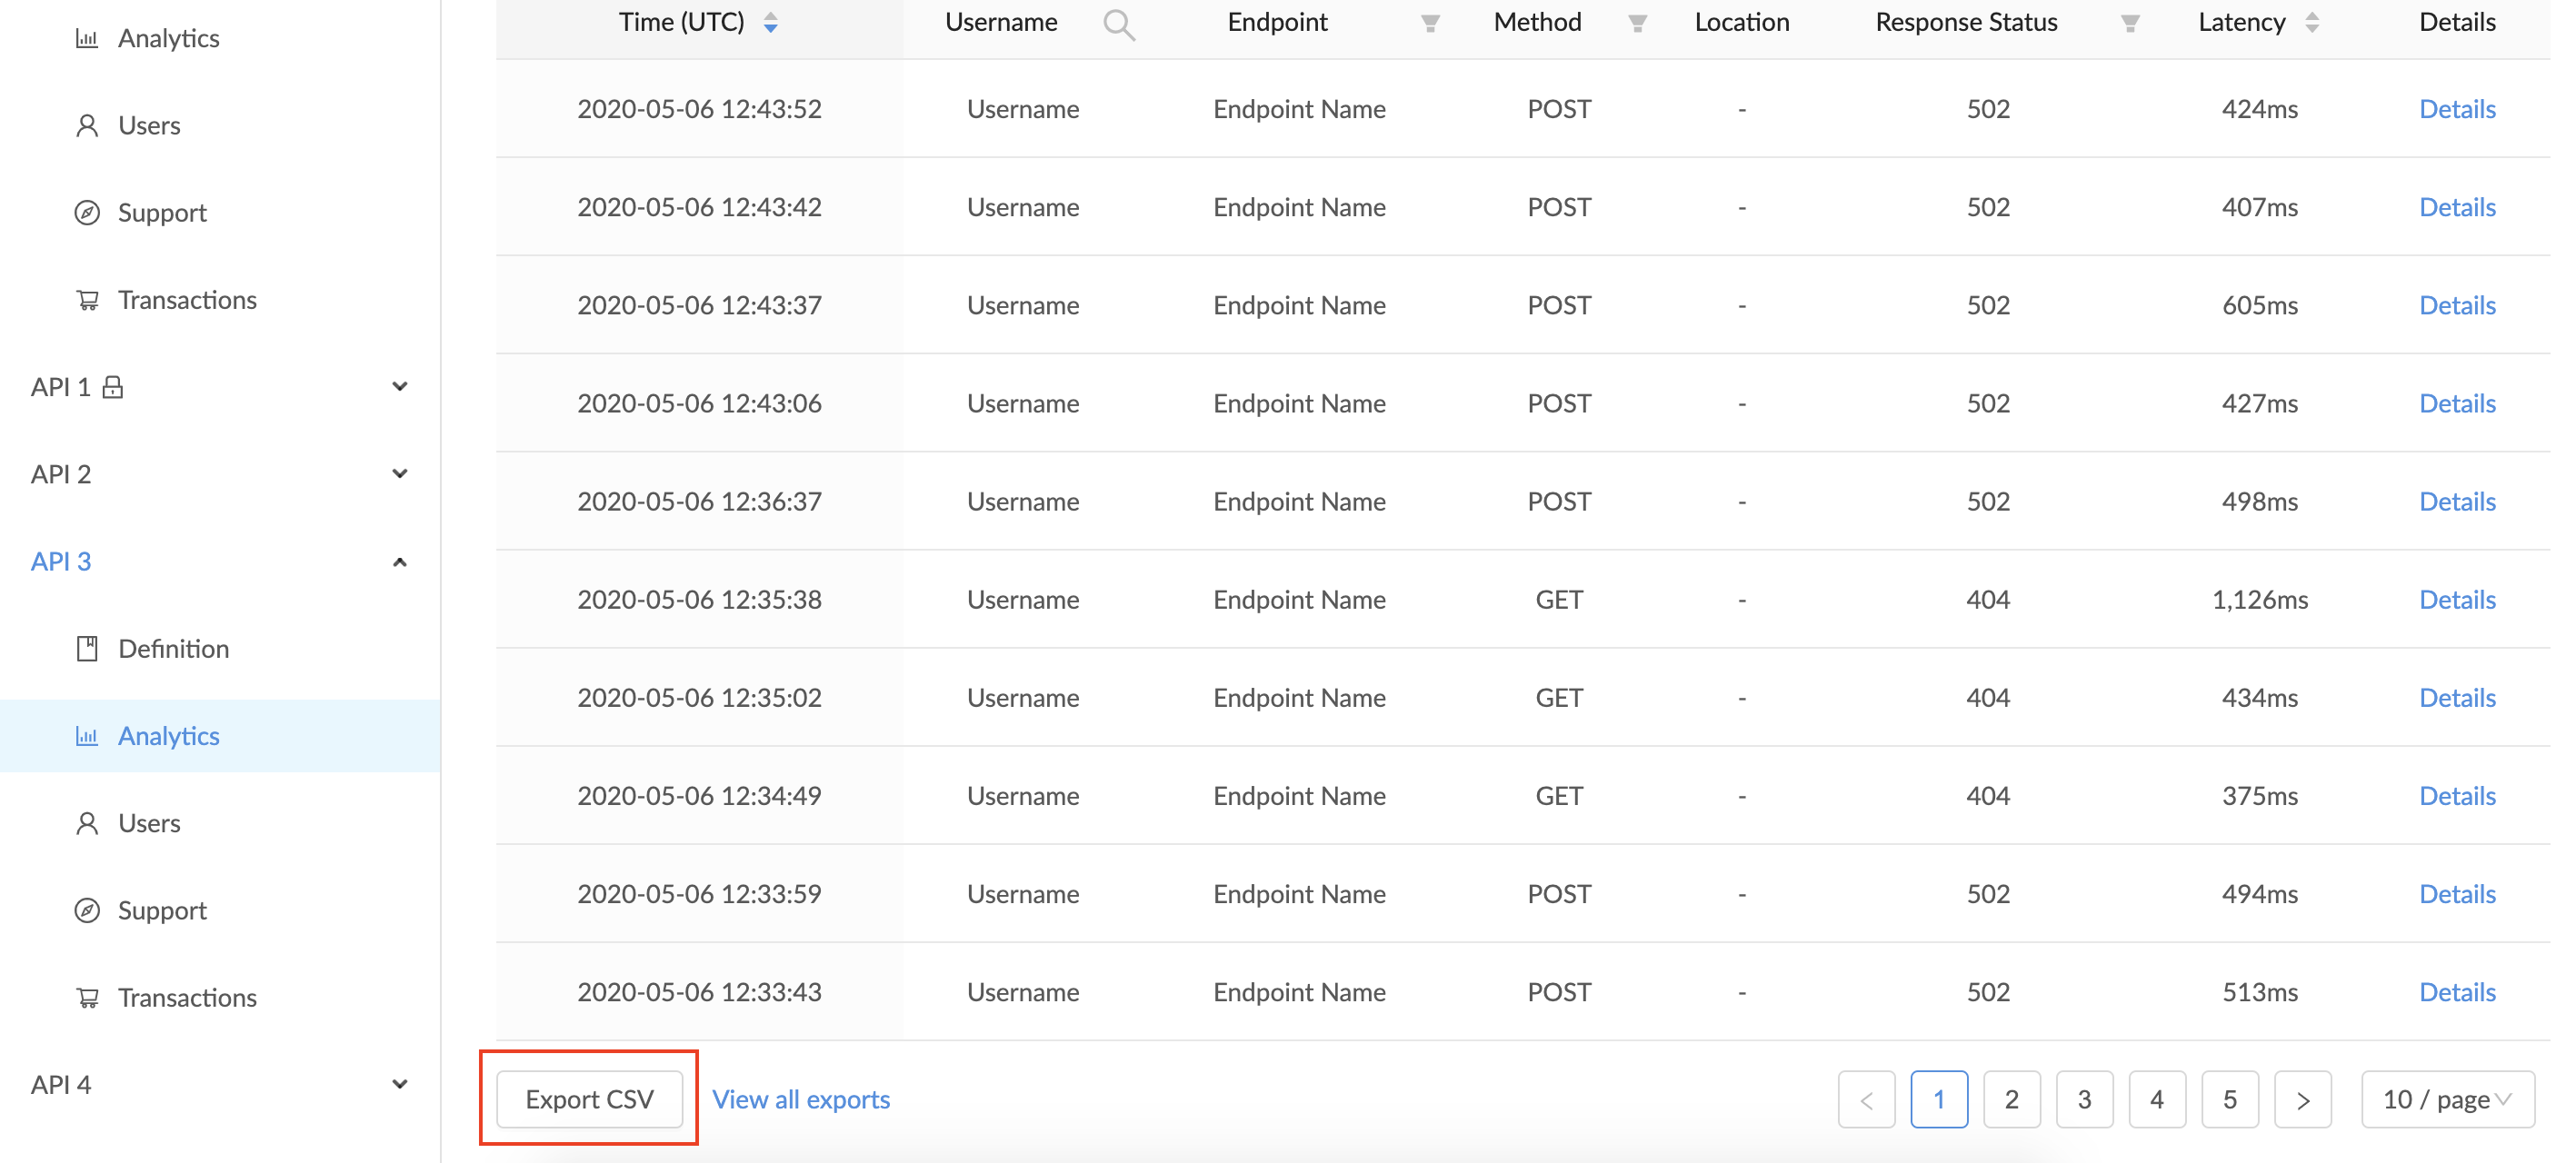
4: You will receive an email with a link to the download when the export is complete. You can also view the export when it is available by clicking the "View all exports" link next to the "Export CSV" button.
Updated 11 months ago